Too Hot To Handle: Nine Overbought Stocks for Traders
When markets are making sharp moves off of the lows, there are two kinds of
stocks that traders should be on the lookout for.
The first group includes those strong stocks, trading above their 200-day
moving averages, that have experienced sharp pullbacks. These are the stocks
that traders who want to buy weakness and sell strength count on, trade in and
trade out.
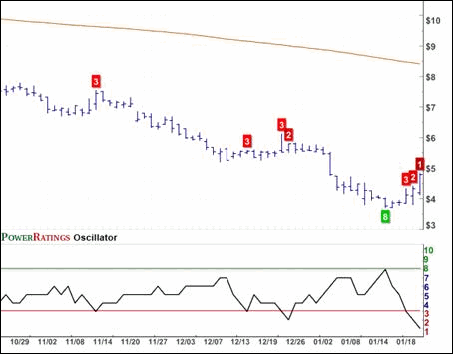
The second group of stocks are those weak stocks, trading below their 200-day
moving averages, that are showing strength as the market moves higher. Because
these are weak stocks, smart traders know that their new-found strength is
likely to be an illusion. So rather than buy these stocks, traders look to short
them with the expectation that they will resume their weak ways once their
temporary impersonations of strong stocks fade.
This is really all there is to it: buy weakness and sell strength. This is
true whether or not you are looking to go long stocks or short them, whether the
market is trending higher or plunging lower.
Depending on the market conditions, there may be more of one type of stock to
trade than the other. For example, when markets are advancing, we tend to see
many stocks moving higher–strong and weak alike. It is during these times that
traders need to be wary of being fooled by the bouncing of some previously
bottom-dwelling stocks. Instead of being seduced by these stocks, traders should
be readying themselves for the almost certain opportunity to profit as many of
these stocks inevitably fall short and return to the lows from whence they came.
The recent reversal in the market, which saw the Dow make a 600-point swing
from intraday lows to closing highs, is an example of the sort of advancing
market that tends to make even battered stocks start to look compelling. Knowing
the proper course of action to take vis-a-vis these stocks is one thing. Knowing
when to take this course of action is another. Our research has found that the
Relavie Strength Index can be a valuable tool in helping traders know when to
say when. As discussed in an article by Ashton Dorkins and Larry Connors a year
ago, when the Relative Strength Index’s default values are adjusted from 14
periods to merely 2, the indicator changes from being a mediocre (at best)
momentum indicator to being perhaps one of the best indicators for short-term
traders looking to exploit oversold and overbought markets.
Click
here to read our research on how to trade stocks using the 2-period RSI.
Another difference in the way that we use this indicator is to look for truly
extreme values before considering a stock oversold or overbought. Thus, rather
than the 30 and 70 levels traditionally used by traders using the RSI to note
oversold and overbought conditions, respectively, we set boundaries at 2 and 98.
This helps ensure that the stocks we are analyzing are experiecning exceptional
degrees of either trader attraction or trader revulsion.
These extreme values, based on our research, are more likely to produce
meaningful price movement–bounding higher when oversold, slipping sharply when
overbought–than the traditional values used with the RSI.
Below is a list of the nine most overbought stocks in terms of their Relative
Strength Values. I have also included the 100-day Historical Volatility (HV) of
each stock. Historical volatility is a measure of price variance, with higher
values suggesting a greater potential for larger price movement. This category
can be used to help narrow down a list of trading candidates to a more
manageable number.
All of the following stocks also have PowerRatings of 1.
Warner Music Group
(
WMG |
Quote |
Chart |
News |
PowerRating). RSI(2): 99.90. HV(100): 53.97
Family Dollar
(
FDO |
Quote |
Chart |
News |
PowerRating). RSI(2): 99.25. HV(100): 47.29 (See chart
below.)

Select Comfort Corporation
(
SCSS |
Quote |
Chart |
News |
PowerRating). RSI(2): 98.88. HV(100): 80.57
Men’s Wearhouse Inc.
(
MW |
Quote |
Chart |
News |
PowerRating). RSI(2): 98.74. HV(100): 75.87 (See chart below.)

Ruby Tuesday
(
RT |
Quote |
Chart |
News |
PowerRating). RSI(2): 98.69. HV(100): 62.36
Ann Taylor
(
ANN |
Quote |
Chart |
News |
PowerRating). RSI(2): 98.51. HV (100): 49.86
Darden Restaurants
(
DRI |
Quote |
Chart |
News |
PowerRating). RSI(2): 98.50. HV(100): 52.69
Hot Topic
(
HOTT |
Quote |
Chart |
News |
PowerRating). RSI(2) 98.22. HV(100): 52.52 (See chart below.)

Volcom Inc.
(
VLCM |
Quote |
Chart |
News |
PowerRating). RSI(2): 98.02. HV(100): 79.07
David Penn is Senior Editor at TradingMarkets.com
