Tools for Traders: Laps Reveal Seven Overbought Stocks
Every morning one of the first stock market trading tools I consult is TradingMarkets
Stock Market Indicators. This roster of trading tools helps me determine in just a few minutes whether we have a market full of strong stocks experiencing temporary weakness or a market loaded with weak stocks experiencing temporary strength.
These indicators can be a very helpful tool for stock traders.
When I see a market like this morning’s, with the market index futures up more than 1% in the hour before the bell, and then check the TradingMarkets Stock Market Indicators page and see an overwhelming number of stocks with low PowerRatings, then I know that the bullishness of the futures is not to be taken without a grain of salt.
Traders are never more bullish than when stocks are overextended and the futures are soaring. But it precisely this type of situation that savvy traders long for as an opportunity to sell, rather than buy, stocks. This is all the more so when markets like the S&P 500, Nasdaq and Dow Industrials remain below their 200-day moving averages. Remember that smart traders look to sell strength, not buy it, whether that means lightening up on profitable long trades taken earlier or even shorting those weaker stocks that are masquerading as strong stocks by gapping
— or lapping — higher.
The idea of stocks “lapping” up is one that Larry Connors has helped pioneer. While many traders are familiar with the idea of stocks “gapping up,” the phenomenon of the “lap up” can be just as powerful
— in addition to appearing more frequently than the more widely known “gap up.” Laps are just another tool that stock traders can use to help spot stocks that are exhibiting atypical behavior
— atypical behavior that may reveal the stock to be an excellent candidate for a trade.
We first wrote about gaps and laps in an
article for TradingMarkets back in December 2006. A “gap up” as most traders know, occurs when a market open significantly beyond its previous high. In an uptrend, for example, a stock closes at 25.00 with a daily high of 25.20. If that stock opens the next morning at 25.50 and manages to close higher still, then that stock is said to have gapped up, leaving a price gap between 25.21 and 25.49 where the stock did not trade.
A lap up is similar to a gap up. But the key difference is that in a lap up, the stock opens the following session above the close of the previous session, but not above the high. Using the example from the previous paragraph, a lap up would occur if instead of opening at 25.50, the stock had opened at 25.15. Here, the stock would have opened above the previous session’s close of 25.00, but below the previous session’s high of 25.20. When this happens, we say that the stock has “lapped up” rather than “gapped up.”
Our research into laps was consistent with our research into gaps:
when stocks that are trading below their 200-day moving averages experience laps or gaps higher, those stocks actually are lower in one-day, two-day and one-week timeframes. And the higher the lap or gap, the lower the stock is likely to be afterward in the near-term.
While it may sound counterintuitive, our research does serve to underscore the validity of buying low and selling high. Laps and gaps higher often represent extreme bullishness
— no less than stocks that have been moving higher for consecutive days or stocks that have 2-period RSI values of 98 or more. And it is this extreme bullishness that, when spotted in an overall context of weakness, is the rightful target of stock traders looking to wager against stocks.
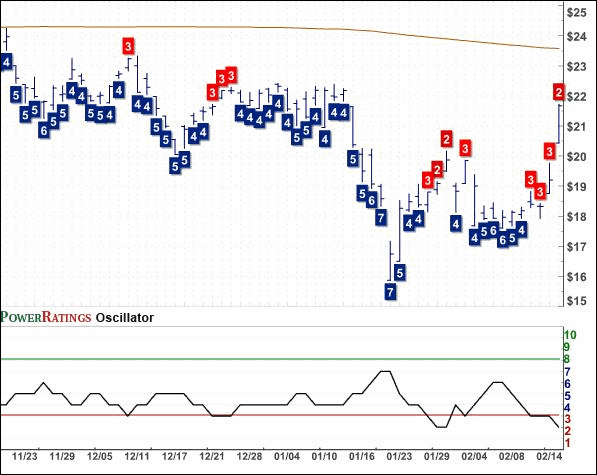
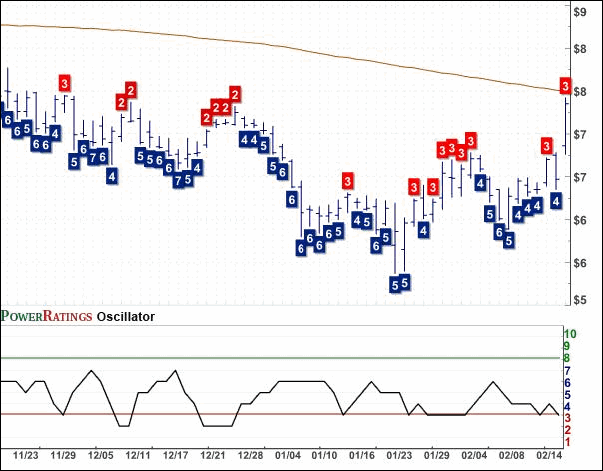
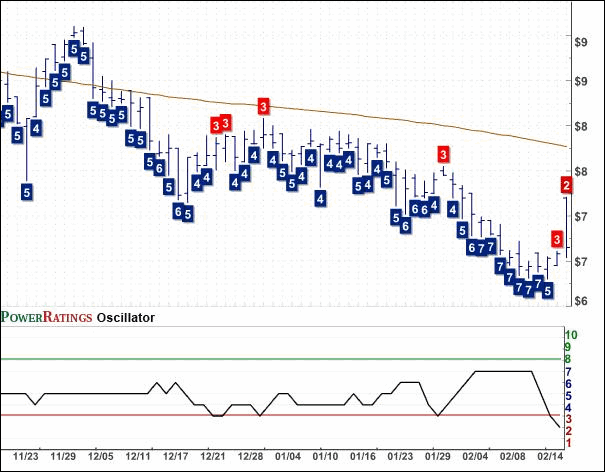
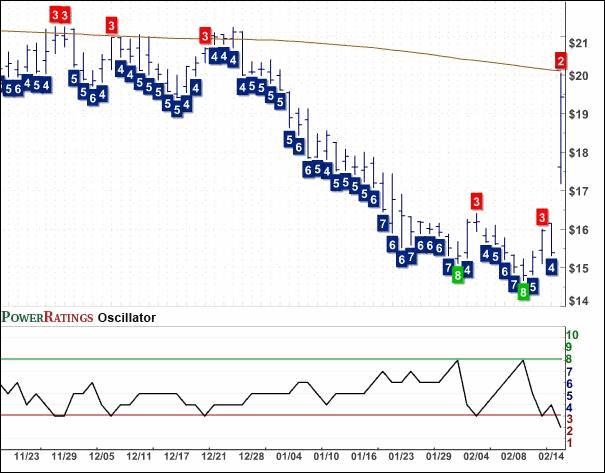
Below are seven such overbought stocks that have lapped up by 5% or more and are below their 200-day moving averages. I have also noted the 2-period RSI values for each of the seven stocks to help traders differentiate more carefully from among the group of overbought stocks. Selected charts have also been included as noted. For more, be sure to check out our PowerRatings charts here.
Alumina Limited
(
AWC |
Quote |
Chart |
News |
PowerRating). PowerRating 3. RSI(2) 99.20. (See chart below)

Brocade Communications
(
BRCD |
Quote |
Chart |
News |
PowerRating). PowerRating 3. RSI(2) 88.56. (See chart below)

Superior Essex Inc.
(
SPSX |
Quote |
Chart |
News |
PowerRating). PowerRating 3.
RSI(2) 82.28
E Trade Financial Corporation
(
ETFC |
Quote |
Chart |
News |
PowerRating).
PowerRating 3. RSI(2) 71.68
Five Star Quality Care Inc.
(
FVE |
Quote |
Chart |
News |
PowerRating).
PowerRating 2. RSI(2) 94.54. (See chart below)

Frontier Airlines Inc.
(
FRNT |
Quote |
Chart |
News |
PowerRating). PowerRating 2. RSI(2) 93.70
Cognex Corporation
(
CGNX |
Quote |
Chart |
News |
PowerRating). PowerRating 2.
RSI(2) 93.10. (See chart below)

David Penn is Senior Editor at TradingMarkets.com
