Trade 17 Commodities At Once?
Most traders are aware of the major equity indexes and their corresponding future contracts and ETF’s. Equity indexes allow the trader to diversify their holding across a myriad of different stocks and industries via the corresponding future contracts and ETF’s. Instead of having to purchase every stock in the S&P 500, the trader can purchase one instrument that will move directly with the cash index.
Imagine applying the same idea as an equity index to commodities. One would be able to trade a diversified pool of commodities in one financial instrument. Hence, trading the commodity complex, as a whole, instead of individual futures.
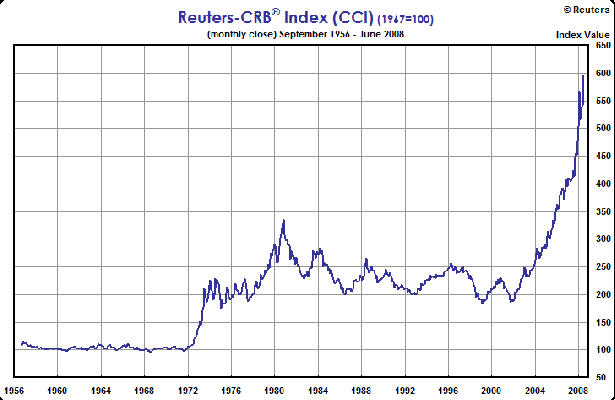
This is a very appealing concept to traders, yet many don’t know these indexes and futures exist. This article will explore the concept of commodity indexing via the most popular index, the Reuters-CRB Index (CCI).
The index has a long history, having first been calculated by the Commodity Research Bureau (CRB) in 1957. The original index contained 28 commodities, 26 of which were exchange traded in North America and 2 cash markets. The index is not weighted, like equity indexes, but rather derived to create a geometric mean of the underlying commodity price relatives.
It’s a ratio of the current price to the base period (1947-49) average price. It’s not a simple average of prices across the components but rather an average of price and time across each underlying commodity. This is known as a 3 dimensional indexing method. The important thing for traders to remember about 3 dimensional indexes is that they rise slower and fall faster than arithmetic indexes. There have been continuous alterations to the components, since inception, to better reflect commodity price trends. Presently, the index contains 17 commodities across the following sectors: Energy, Grains, Industrials, Livestock, Precious Metals, and Softs.

Now that I have explained the basic makeup of the Reuters-CRB index, how does one go about trading it and why would you?
First for the why: Commodities are thought to be counter cyclical to equities, thus making the index an ideal hedge to a stock portfolio. In addition, since it is extremely difficult to properly diversify your holdings as a commodity futures trader, the index is designed to represent a diversified pool of commodities in one easy to use product.
In 1986, futures were first offered on the index. Their symbol is CR and they are presently electronically traded on the ICE. They are calculated at $50.00 times the index value and have a minimum tick size of 10 basis points or $5.00. There are no exchange imposed price move limits, however there is a 50,000 contract position maximum. The contracts are listed in March, June, September and December.
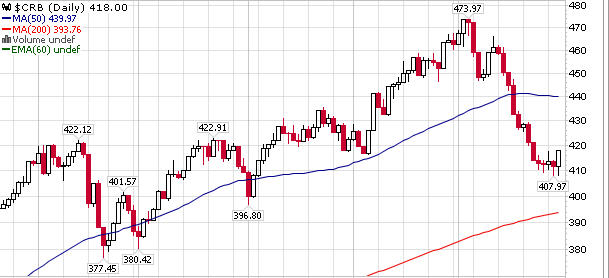
There has been a dramatic pull back from the indexes high recently. Price crashed through the 50-day Simple Moving Average in the middle of July and just yesterday rebounded a little. I would not be surprised if we see a test of the 50-day SMA around 440 before the end of the year. However, price is still above the 200-day SMA at 393.76.
Regardless of your bias here, the Reuters-CRB Index is a tool every trader should know about.

David Goodboy is Vice President of Marketing for a New York City based multi-strategy fund.
