Trade ‘Em As You See ‘Em
Earnings
continue to hit the tape, and whether or not you believe the spin
corporate executives are putting on them, the tape is telling us that things are
OK. Technically the averages are still vulnerable to a sell-off since they are
up against good resistance, but it just does not feel like there is much selling
pressure out there. You know what that means…trade them as you see them.
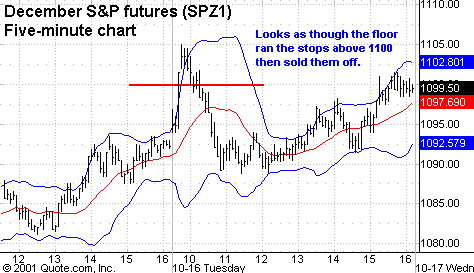
Yesterday’s early morning action is
worth noting however, granted part of it is speculation, but I have seen it
enough times to believe otherwise. In the early going, the S&Ps made a sharp
move towards 1100, and unlike most times an index approaches a “round”
number where it consolidates then makes a run through the number, yesterday it
just smashed right through. Unfortunately, it came straight back down, giving up
all the early morning gains. What most of you witnessed was the floor running
through buy stop orders resting just above 1100. The bars on the five minute
chart below clearly show a frenzy of buying. The rally also stopped just short
of the 50-day moving average at 1108. I even remember saying to other traders in
the office that the move felt a bit odd. Contrary to what I normally do
preach in my column (trade with the trend), this was one of those exceptions
where you needed to fade the move (go short). It paid off handsomely.


The remainder of the day was much like
other recent trading sessions. There were a few setups in the afternoon, but
nothing terribly exciting.
Now that
(
IBM |
Quote |
Chart |
News |
PowerRating) and
(
INTC |
Quote |
Chart |
News |
PowerRating)
have released their earnings (trying to decipher them with FASB or GAAP methods
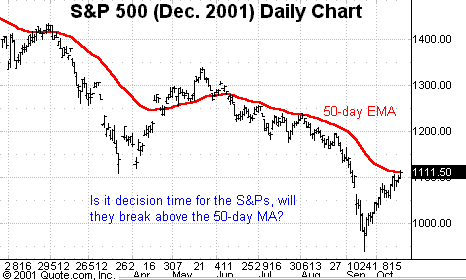
however is an act in futility), perhaps the market will get busy deciding where
we go next. The daily chart of the December S&P futures is certainly in
position to offer some excellent volatility once it makes a clean break either
way. The pattern and the way the market is trading is very similar to that of
late August.
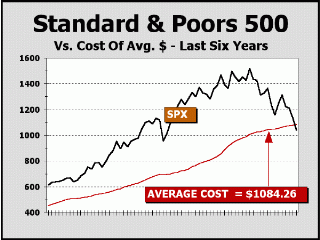
For those of you who are interested in
some perspective on the current market, I think you will find the graphs below
quite intriguing. By no means is this a timing or directional indicator, but is
is a sobering snapshot of the current state of long-term investors. (*
The following two charts and paragraph are from Alan M. Newman, Editor HD
Brous & Co., Inc.’s Crosscurrents)


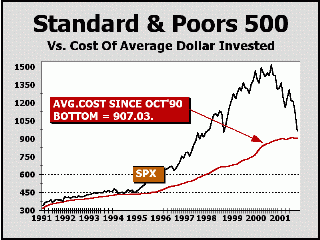
"Going as far back as the bear market
bottom of 1990 affords another scary perspective, illustrating how close
investors are now to giving up all their the
gains from the last eleven years, the entire bull market measured from 1990!
At the Sept. 21, 2001 close of 965.80 shown on our second chart, investors who
had laddered in since the beginning of the bull market were ahead by only 6.5%.
At the Sept. 21 print low of 944.75, they were ahead by a mere 4.2%. At
the Sept. 30 close of 1040.94, investors were ahead by only 14.8%, equivalent to
a compounded rate of less than 1.3%!"
The point that Mr. Newman is
making is that up until now investors have held the course, if the market were
to decline further, would they still be that valiant?
Keep an eye and ear out as Greenspan
will be speaking sometime today, this could a add a nice dose of volatility to
intraday trading.
Key Technical
Numbers
| S&Ps |
NASDAQ |
| 1139 |
1507 |
| 1131.33 |
1477 |
| 1122 |
1448.43 |
| 1116.66 |
1428.33 (confluence) |
| 1108.42 (Very Key) | 1414.75 |
| 1098.25 | 1400 |
| 1083 |
1383 |
| 1074 |
1361.67 |
As always, feel free to send me your
comments or questions. Have a great trading day.
