Trade ‘Em As You See ‘Em
With this morning’s move up in the futures,
it appears as though there is now little doubt that a new up leg is clearly in
place. Frankly, it was obvious last Friday as several technical levels held. The
question now is how much further? I do not know. However, a large move such as
the one witnessed over the last few days will need to be digested, so some sort
of pullback and consolidation is certainly in the cards. I see some critical
resistance right here at the pre-market highs, 866-67.
Unless you are positioned on the long side already, today’s indication of a
gap higher opening can pose frustration to HVT.
It is what I call a “Gap and Crap,” a situation where stocks simply
gap higher and move sideways for the remainder of the day. If it does pan out
that way, trade lightly if at all. There will always be better opportunities.
In the non-HVT department, you may want
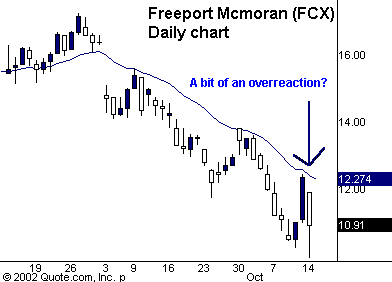
to keep an eye on Freeport McMoran
(
FCX |
Quote |
Chart |
News |
PowerRating). Yesterday it was whacked for an 11% loss on the heels of the bombing
in Bali. As I understand it, FCXs’ largest gold mine is in Indonesia, but 1,500
miles from Bali and certainly not in an area that draws large number of
tourists. So, was the selling overdone on an emotional level? Probably, however,
the chart itself was nothing to write home about to begin with, so if there is a
bounce, it is probably just that — a bounce. Do not fall in love with the
trade.

There simply is not much to go into at this point. The market is higher, it
is due for some consolidation, but I am not about to try to figure out exactly
when and for how much. Like all traders, the best plan of attack is to
“trade ’em as you see ’em.” Traders have been buying the intraday
pullbacks, and each pullback and subsequent pullback are all occurring at
technical levels. These levels intraday are either Fibonacci or pivot points.
Know these levels.
I will look to fade the opening gap prices on the stocks I trade. This is
merely a trade, and it will be the only trade I do today that bucks the trend.
After that I will trade in the direction of the market based on the one-minute
chart.
Key Technical
Numbers (futures):
S&Ps |
Nasdaq |
| *872* | 933 |
| 857.50 | 927 |
| 847 | 922.25 |
| 842 | 917.50 |
| 838 | *908-10* |
| 822 | 898.75 |
| *815-16* | 893.25 |
| *805* | 888.50 |
| 882.50 |
* indicates a level that we feel is more significant.
As always, feel free to send me your comments and
questions. See you in TradersWire.
