Trade The High Probability Zones
The tooth fairy showed
up yesterday and it was a trend-up, wire-to-wire day. The internals
were strong early and got considerably stronger as the day progressed. For
example, at 12:45 PM, the SPX was 1168.50, with an up volume/down volume ratio
of 3.75:1 and breadth +1290. At 1:30 PM the SPX was still 1168.90, but the ratio
had improved to 4.5:1 and breadth +1430. The SPX ranged between 1170.50 –
1166.77 from 10:30 AM until 1:50 PM when the SPX popped to 1176, closing at
1175.65, +1.2%, as did the Dow, to 10385, and QQQQ, to 35.73. The Nasdaq closed
+1.5% at 1962. The final up volume/down volume ratio ended at 6.5:1 and the
regular volume ratio was 87 with the final breadth at +1753. NYSE volume had
expanded to 1.8 billion shares.
Many of the leading percentage gainers in big-cap
stocks were “below the line stocks” that had declined much more than the SPX and
Dow during this decline from 1229.11 to 1136.14 (-7.6%). It was also evident in
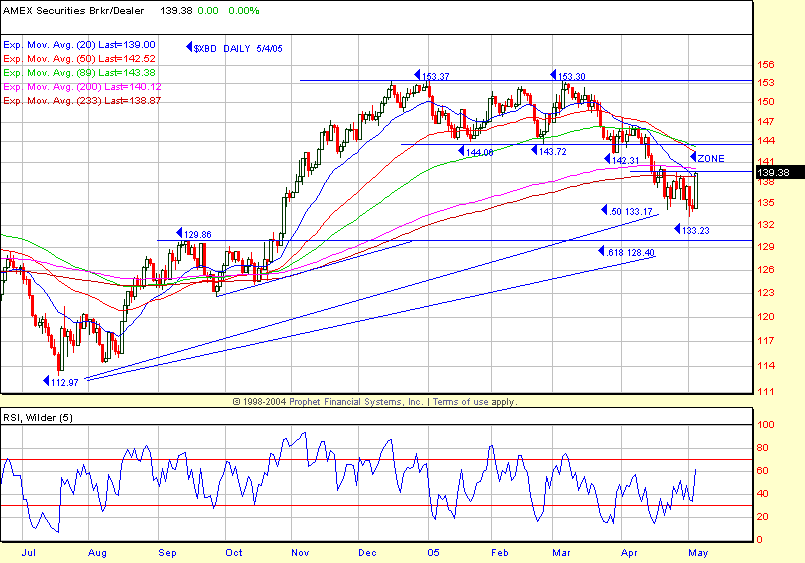
the sectors, as the XBD was +3.7% and SMH, +2%. There were shorts scrambling to
cover stocks in addition to the real Generals buying. Those are the sectors we
need to make a move if the Wave 5 leg is to extend above 1229.11. The energy
sector gave daytraders another bonus day as the OIH was +1.8% and XLE, +1.2%.
There were early RST long setups in the OIH which ran +2.7% from entry and the
XLE, +1.6% from entry. If you happened to have taken the RDC RST, it traded
+3.7% from entry. These will be discussed in next Monday’s Inner Circle meeting.
The cyclicals also did better than the SPX at +1.7%, as did the BKX, +1.4%.
For major index traders, the QQQQ Flip Top
breakout above 35.37 was the best major index setup simply because it was at the
biggest discount to its primary resistance from 36.40 to 37 and the minor
resistance at 36. The QQQQ traded +1.3% from entry to a 35.83 intraday high,
with yesterday’s 1.5 volatility band at 35.80. The same Flip Top trade was
available in the SMH and after the breakout above 31.30, it ran +1.6% to a 31.79
high and 31.64 close. The +2.0 volatility band was 31.88. The SPY closed above
the primary resistance/neckline at 117.75 and selling is expected in the
118.40 – 119.60 retracement zone to the March 123.25 high. The DIA closed at
103.77, just above the 103.71 200-day EMA and 233-day EMA at 103.29. They,
of course, are your immediate downside focus. I expect significant selling to
show up in the 104.86 (.50 retracement) – 106 (.618 retracement) zone. The
primary resistance/neckline is about 104. The QQQQ has minor resistance at 36
and the primary resistance at 36.40 – 37, which includes all of the declining
longer-term moving averages.
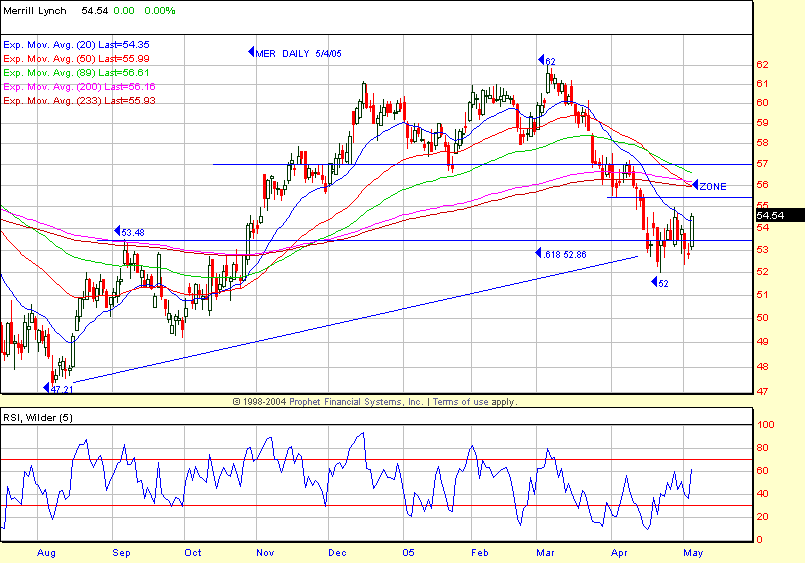
If you are trading individual stocks, your best
selling zones are on the retracement to the declining longer-term moving
averages, not when they are extended down to, for example, the -2.0 standard
deviation band (6 months) like they were on this current decline. As an example,
see today’s XBD chart with the zone where it is better to look for shorts: 140 –
144. The high end of the zone is about an 8% retracement from the 133.23 low ,
which occurred after the initial break of the longer-term moving averages. Entry
at the lowest common denominator means tighter stops and less risk. The MER
chart indicates a higher probability sell zone of 56 – 57. This enables
you to keep a very tight stop and if the world suddenly changes you are able to
cover quickly and reverse with little pain. Of course, that is what we hope
happens this time, but we must trade the current reality which is a negative
chart (what is).
Have a good trading day,
Kevin Haggerty
P.S. I will be
referring to some charts here:
www.thechartstore.com in the future.


