Tradeable Rally?
Greenspan
is certainly pushing monetary policy ahead far enough that the economy ought to
recover sometime in the next year. The
question that remains is if monetary stimulus will do much to solve an
overcapacity problem and a tapped out consumer. Until we get some economic recovery evidence, the jury is still out on
that question. Another question
that will likely develop down the road is whether an economic recovery will feed
into an earnings recovery. Recoveries
in Asia since 1998 have been profitless and are based on the same overcapacity
problem the U.S. has developed since then. Will the U.S. recovery be relatively profitless too, meaning that
earnings growth will not return to the market?
Keep in mind that these questions are not yet answered — and that the
answer to these questions will tell us how long in duration the current
fireworks will last.

In
the meantime, as we’ve been noting for the last few weeks, there are some good
technical indications of at least an intermediate-term rally in place.
Certainly the broad indices put in very nice follow-through days galore
yesterday, which was encouraging. Although
we didn’t get any of our other breadth indications yet (see comments of prior
two weeks), we have gotten close on upside volume a few times.
And sentiment has improved markedly with hope based on Fed rate cuts.
Now we have to see if the onslaught of earnings news will allow the
market to maintain these gains. With
so many questions unanswered, we wouldn’t be surprised if at least a retest of
the lows develops in the weeks and months ahead, but in the meantime, we may be
in at least a catchable rally here, and who knows, maybe this is the beginning
of something even bigger. We have a
nice double bottom in the Dow, a mini Head-and-shoulders bottom in the Naz, and
a small double bottom in the S&P that have been formed.
None of these are weekly, longer-term basing patterns, but they are
shorter-term mini-bases that should lead to more upside action at least.

Leading
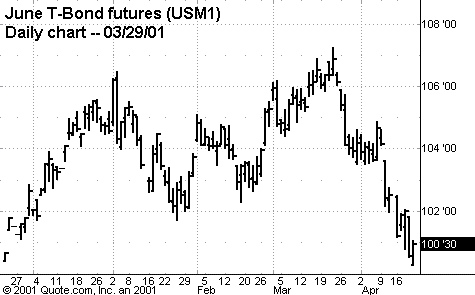
markets are now showing good progress. Bonds
have completed a large weekly double top.
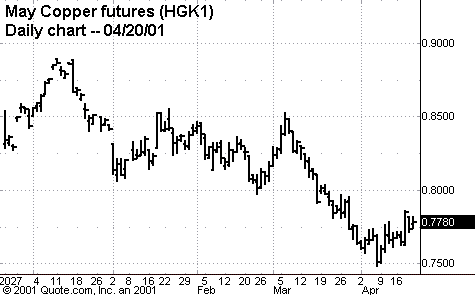
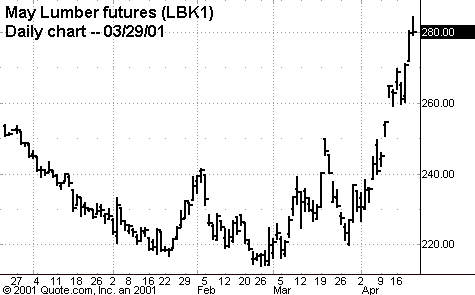
Copper has completed a mini head-and-shoulders bottom, and Lumber has
broken out of a sloppy double-bottom base.
So the economy is giving advance indications of starting to turn! Keep watching here, and also keep your eye on leading
economic indicators. These leading
economic gauges are now in positive mode at least for the short-term for the
first time in many, many months.

Continue
to watch our breadth indicators carefully for signs of a REAL rally developing. Look for
another one or more of the following breadth tools to indicate a
possible strong leg up before getting too excited about buying stocks again:Â 1) the five-day
MA of up volume being greater than 77% of the five-day MA of total volume on a day after the low has been made;Â 2) the
11-day MA of advances are >1.9 times the 11-day MA of
declines;Â 3) up volume/(up volume +
down volume) is >90% on a given day;Â 4)
the S&P rises by 2.75% or more on a given day and 70% of issues traded
advance on the NYSE;Â 5) After the
fifth day following a market low price, we get a strong follow-through day, a day
where two or more of the major averages are up more than 1% on volume that is up
from the prior day and at least 20% above the 50-day MA of volume;Â 6) finally, and most importantly, that we get a large number of breakouts
to new 52-week highs by stocks that are strong EPS and strong RS leaders
breaking out of bases that are four-plus-week solid bases on strong volume. This
week we got one heck of a follow-through day.
We would be very surprised if a new bull market were to launch without at
least one (and probably more) of the above other breadth-thrust indicators flashing
a buy.Â
Let’s
look at some numbers from the week. New
Highs vs. New Lows on our RS/EPS lists were 9/8,
20/5, 21/5 and 42/3 — as new highs continue to lead, but are not yet
consistently kicking butt. There
were roughly nine breakouts on the upside to new highs of stocks on our Top RS/EPS
New Highs lists, with only two breakdowns on the downside of a four-week-plus consolidations on our Bottom RS/EPS
New Lows lists. More
significantly there were another two close-calls on the upside this week [Metro
One Telecommunications
(
MTON |
Quote |
Chart |
News |
PowerRating) and Americredit
(
ACF |
Quote |
Chart |
News |
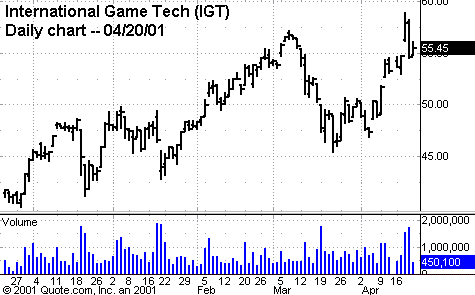
PowerRating)] along with two stocks that gave buy signals finally
[International Game Tech
(
IGT |
Quote |
Chart |
News |
PowerRating) and Atlas Pipeline Partners
(
APL |
Quote |
Chart |
News |
PowerRating)];
while no close calls on the downside.
Close calls are stocks almost meeting our criteria that broke out of
sound bases. Of course, a truly good
environment would show five or more times this number of breakouts with dozens of
close-calls or stocks actually meeting our criteria breaking out.
But there has been some of the sharp improvement we’ve seen here in the
last couple weeks.yes”>
Our
overall allocation is still DEFENSIVE with 8% short and 16% long and the
remaining 76% in T-bills awaiting new opportunities.
Our model portfolio followed up weekly in this column ended 2000 with
about an 82% gain on a 12% maximum drawdown, following a gain of around 41%
the prior year. For the year 2001, we
are now down about 1.5%, with a mostly cash position.
For
those not familiar with our long/short strategies, we suggest you review my
10-week trading course on TradingMarkets.com, as well as in my book The
Hedge Fund Edge and course “The
Science of Trading.” Basically,
we have rigorous criteria for potential long stocks that we call “up-fuel,”
as well as rigorous criteria for potential short stocks that we call “down-fuel.”
Each day we review the list of new highs on our “Top RS and EPS New
High list” published on TradingMarkets.com for breakouts of four-week or
longer flags, or of valid cup-and-handles of more than four weeks.
Buy trades are taken only on valid breakouts of stocks that also meet our
up-fuel criteria. Shorts are similarly
taken only in stocks meeting our down-fuel criteria that have valid breakdowns
of four-plus-week flags or cup-and-handles on the downside.
We continue to buy new signals and sell short new short signals until our
portfolio is 100% long and 100% short (less aggressive investors stop at 50%
long and 50% short). In early March of
2000 we
took half profits on nearly all positions and lightened up considerably as a
sea-change in the new economy/old economy theme appeared to be upon us. We’ve been effectively defensive ever since, and are now as
defensive as possible.
Upside
breakouts meeting up-fuel criteria (and still open positions) so far this year
are: Atlas Pipeline
(
APL |
Quote |
Chart |
News |
PowerRating) @28 (32.02) w/26 ops; and International Game Tech
(
IGT |
Quote |
Chart |
News |
PowerRating) @57.95 w/49 ops;Â Continue to
watch our NH list and buy flags or cup-and-handle breakouts in NH’s meeting our
up-fuel criteria — but continue to add just two per week.Â

On
the downside, this year we’ve had breakdowns from flags (one can use a down
cup-and-handle here as well) in stocks meeting our down-fuel criteria (and still
open positions) in: Rogers Communications
(
RG |
Quote |
Chart |
News |
PowerRating)
@14.32 (12.69) — now take half profits and use 13.25 ops on the other half to
lock in profits. Continue to watch
our NL list daily and to short any stock meeting our down-fuel criteria (see 10-week trading course) breaking down out of a downward flag or down
cup-and-handle. Here, too, remain
cautious by only adding two shorts in a week, until we get more consistency
in the number of downside breakouts in a given week off of our Bottom RS/EPS New
Lows lists.
Is
this THE bottom? Don’t know, and
don’t care. If it leads to a new
bull market, we’ll soon have more breadth, and a much better environment with
many breakouts in leading stocks that meet our fuel criteria.
Until then, such theorizing is academic at best. When valid breakouts of
up-fuel or down-fuel stocks become abundant again,
we’ll pounce with both hands. Until
then, we must tread cautiously to avoid getting chewed up.
If a real bottom develops, don’t worry about missing it — when a clear
uptrend begins, we’ll catch up to the gains since the bottom by being in the
leading stocks a few weeks or months after the bottom is in.
