Traders View for 2008
Kevin Haggerty is a
full-time professional trader who was head of trading for Fidelity Capital
Markets for seven years. Would you like Kevin to alert you of opportunities in
stocks, the SPYs, QQQQs (and more) for the next day’s trading?
Click here for a free one-week trial to Kevin Haggerty’s Professional
Trading Service or call 888-484-8220 ext. 1.
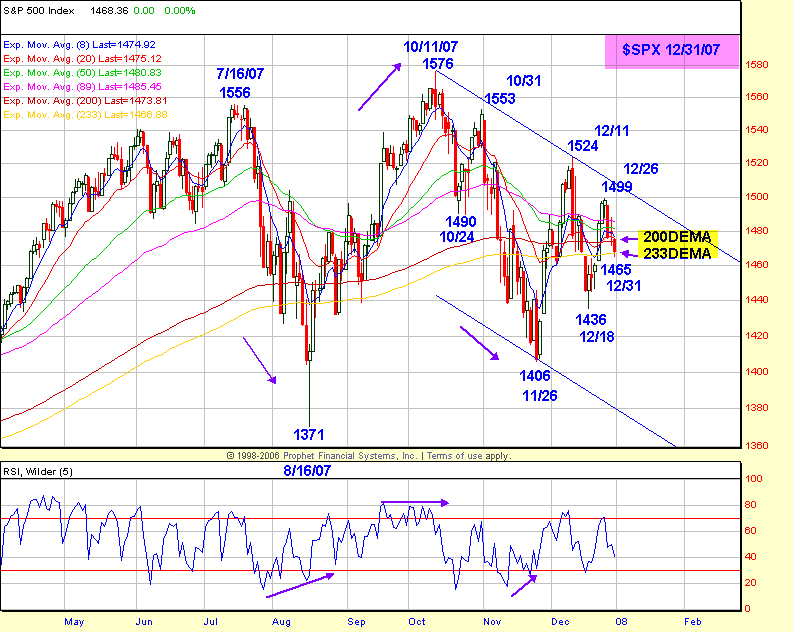
2007 ended on a weak note, with the SPX closing at 1468.36, which was -1.1%
over the last 5 days, and +3.56% for the year. The $INDU was +6.4% for 2007,
while the QQQQ led at +18.6%. The new year starts off with the same problems
that will weigh on the market in 2008. These are the expanding housing decline,
rising oil prices, a weak $US Dollar, tighter credit, and sinking consumer
confidence. This will lead to a decline in Q1 2008 corporate profits, as
analysts have already and will continue to lower the SPX 2008 estimates. They
always follow the obvious, so there is usually a big lag time to actually
lowering estimates or making the rare “sell” call because these firms make more
money when people are buying stocks, not selling them or sitting with cash in
money market funds. The 2008 spin by some portfolio strategists is for the
financials to lead in 2008, in addition to overweighting healthcare, defensive
stocks, utilities, and to remain overweighted in energy, but to lighten up on
commodity, materials and industrial sectors due to a slowing global economy.
That doesn’t sound much like a positive bull market recommendation for me.
However, as traders we don’t have the cash surplus to bottom fish the banks,
brokers, etc, and we must trade reality, which is price.
There are significant negative technical divergences, which point to more
downside for the equity market. The cap-weighted SPX index made new cycle highs
to 1576 on 10/11/07, but the equal-weighted SPX (RSP) failed to do the same. The
$INDU also made a new cycle high in October, but it was not confirmed by the $INDU
Transports ($TRAN), so that bothers the “Dow Theory” advocates. The foreign
indexes, like the $FTSE, $DAX, $EUR (EURO Top 100), $NIKK, and $TSE all made
their cycle highs in July, and failed to confirm the US index cycle highs. The $CAC
topped out in June. The financials, retail, consumer discretionary, semis,
transportation, and real estate sectors are all in their own bear markets as
defined by my Below The Line definition (BTL) where the 20-day ema < 50-day ema
< 200-day ema. The IWM is also in this category, and that mirrors the outlook for
2008 that big cap stocks will outperform small cap stocks due to a weak $US
Dollar and a slowing global economy. On the bull market side of the ledger (ATL)
remains energy, gold, materials, consumer staples, healthcare and utilities. The
BTL and ATL summary by symbols is as follows.
BTL: IWM, $BKX, $XBD, XLF, RTH, XRT, XLY, SMH, $TRAN, IYR.
ATL: XLE, OIH, XLB, GLD, XLV, TLT.
In the major US Indexes, the SPX closed the year below the 200-day ema at
1474 and just above the 1467 233-day ema. The $INDU closed the year at 13264,
versus the 13230 200-day ema. The QQQQ went out above its 200-day ema (49.00),
closing at 51.21. My guess is that it will take new 2008 leadership in the BTL
sectors and continued strength in the ATL sectors to forestall or delay the bear
market decline, taking the SPX, etc, to new market lows in 2008. The PPT (Plunge
Protection Team) also has their work cut out for them in Q1 2008, as the market
gets hit with the same negative write-down and tighter credit news. The major
indexes have held up quite well with all the negative news, but it has been on a
much smaller percentage of big-cap stocks, and probably the ongoing buying by
the Trusts for the ETFs which keep flooding the market, and that is a good
thing. There are other significant negative divergences in money flow, momentum
and breadth (skewed by the negative financial sector). The SPX is in a downward
trend channel from the October 1576 cycle high, and there is some significant
time symmetry from 1/4-1/12, so there will be increased volatility, and the
200-233-day ema zone will be resolved one way or the other. Traders will know
early on if there will be new leadership in 2008 to reverse or slow this
downtrend, and then it will be easy to determine where the primary trader focus
should be going forward.
Check out Kevin’s strategies and more in
the
1st Hour Reversals Module,
Sequence Trading Module,
Trading With The Generals 2004 and the
1-2-3 Trading Module.
Have a good trading day and Happy New Year,
Kevin Haggerty

