Trading and the VIX: The Right Way to Understand the Volatility Index
As stocks soared into the end of the holiday-shortened week, one of the memes that developed was how bullish it was that the VIX was at a six-month low. Everyone from Bloomberg commentators to the gang at CNBC’s “Fast Money” was remarking on how much sentiment had changed among traders and how impressive it was that the VIX had fallen to levels not seen since September 2008.
Larry Connors, author of the new book, High Probability ETF Trading (click here to pre-order), has done some of the most worthwhile analysis of the VIX, or CBOE Volatility Index, over the past decade. Most importantly, Larry has quantified the most important features of the VIX for traders looking for ways to understand and use volatility in their own trading — including the trading of volatility itself using futures, options and now, ETFs and ETNs.
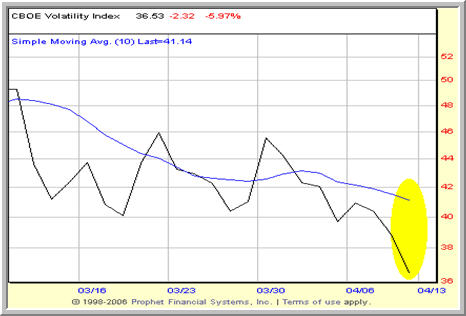
CBOE Volatility Index – VIX

What Larry discovered, and shared with traders in books like How Markets Really Work and Short Term Trading Strategies That Work, is that too many traders see the VIX as a static indicator. How many times have we heard an analyst say that the VIX is “low” when it reaches a certain level and “high” when it reaches another?
Instead, Larry showed how what is most important is the VIX’s relationship to itself. In other words, the VIX is a dynamic indicator. In order to understand and trade with the VIX, traders need to compare the VIX’s current level not with some specific, “magic” threshold level, but with its own previous levels. It is when the VIX begins to deviate significantly from its own mean, its own average price, that the VIX becomes an effective tool for traders.
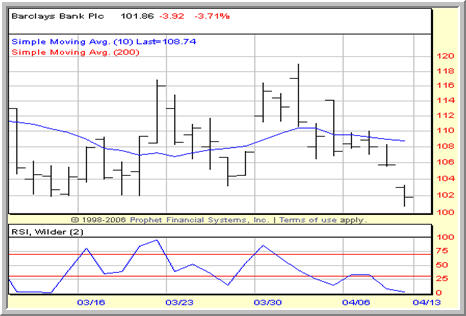
iPath S&P 500 VIX Short-Term Futures ETN – VXX

By using a 10-day simple moving average, Larry noted that when the VIX becomes significantly stretched above the moving average (“significant” meaning 5% or more), markets have a tendency to advance. Conversely, when the VIX becomes very much stretched below its 10-day moving average, markets have historically tended to move sideways to down.
The time frame for this outperformance and underperformance is approximately five days — making this approach to trading the VIX ideal for short term traders of stocks and ETFs.
What are especially appealing about these insights into how to trade the VIX is that they are consistent with Larry’s other observations about how markets really work. Again, Larry has found another application for the notion of buying oversold markets and selling overbought ones, buying fear and selling greed.
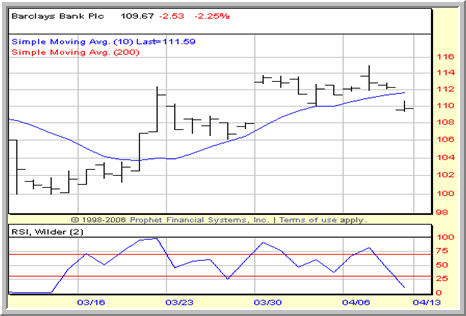
iPath S&P 500 VIX Mid-Term Futures ETN – VXZ

So the next time you hear or read someone talking about the VIX, pull up a chart with the 10-day moving average and see for yourself just where the VIX lies. What you see may help make a major difference in your trading at crucial, and often emotional, short term turning points in the market.
Learn more high probability strategies for trading stocks and ETFs in the short term in the new book by Larry Connors, High Probability ETF Trading, now available for pre-order. Click here.
David Penn is Editor in Chief at TradingMarkets.com.
