Trading By The Floyd Numbers
As all traders know, the markets have presented
unique challenges in the past
year or so. Gone are the days of extreme volatility and 10-, 20- or 30-point
price ranges for stocks, let alone futures. However, do not think for a minute that trading is
impossible. Yes, it is more challenging, perhaps reflecting
reality. The late 90s were most likely an anomaly, resulting in some
misconceptions about a practical trading approach. In retrospect, I was
fortunate to have got my start back in 1994, before the hype machine kicked
in.
While I was not successful early on, I did manage to learn valuable
lessons in what I would call a “normal” market. Back then, the
group I traded with were not real big fans of charts, in fact, our stations had
only two charts, a 5-minute and a tick chart of the S&P 500 futures. I
remember the principal of the firm stating: “What do you find in every sunken ship in the ocean?
A
chart.” His disdain for charts was
obvious. Me being new to the
“game,” went with the flow and learned how to read the tape.
This guy proved beyond a shadow of a doubt that tape reading alone is a very
effective approach.
As the years went by and I set up my own trading desk and met other traders,
I was introduced to more formal charting techniques. It was not long
before I could see the benefit of combining the two approaches, tape reading and
technical analysis. And this brings me to the theme of this lesson,
technical analysis for HVT (High Velocity
Trading). It is next to impossible to give a dissertation on tape reading.
Frankly, it is such an amorphous subject that on-the-job training is the only
way to learn it. Without a solid foundation in either, trading the current
market environment is tricky. If you are not familiar with my approach, I
suggest going back and reviewing my previous lessons before moving on.
Technical levels are not an absolute measure, I have never seen one that is,
from a daytrading standpoint. Rarely do securities stop on a dime, allow
you to establish a position, then go in the desired direction. It is more
of a dance that you need to get in synch with, which is where market dynamics
and tape reading come into play. The point is simple: The technical level
you have picked as being relevant must fit in with a
setup you have
already identified. It is when this occurs that you have powerful reasons
to take the trade. Let’s take a look:
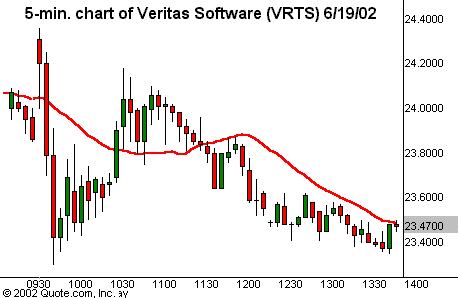
The 5-minute chart of Veritas Software
(
VRTS |
Quote |
Chart |
News |
PowerRating)
is an excellent example. If I look at this chart, it says one thing thing
to me, on the opening of June 19, the stock was under enormous pressure.
So, at first glance, why would I ever consider going long? My style has
always been to trade with the trend. In this case, the trend is clearly
down.

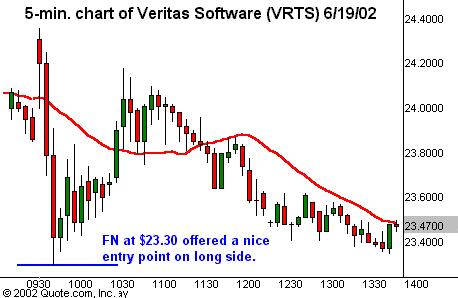
However, if you look at the second chart, which is the same stock
and time frame, but insert a new piece of data previously unknown, a KTN
or as they have been named in my trading office by the traders,
The
Floyd Numbers
(FNs), and suddenly I have a different view. Yes, this is
perhaps a higher-risk trade than one that stays with the trend, but with a tight
stop, it is a very reasonable trade.

Naturally, this was not a slam
dunk. Any of you who
took the trade may have had the stomach acid flowing. But if you add into
this the market dynamics at the time and the fact that the S&P futures were
sitting on a KTN, it made the trade possible.
The point being made here is
simple: Use technical
levels as a complement to your existing approach, not as a substitute.
Naturally, there will be many occasions where a technical level coincides with a
pullback to a moving average, etc. That is normal, it is the nature of markets
to magically come together, there is an order to the markets which goes beyond
explanation. The Random Walk Theory
that academics, not traders, propose is pure BS.
The second example shows the more traditional
setup
that I do on a day-to-day basis. Regardless of the FN, the
setup was
excellent. The first chart shows the setup without the FN,
then with it. Either way, the trade worked. However, when I have this
type of a setup with a FN, I will typically double or sometimes triple my share
size on the trade. Which leads to a point I will mention briefly, but
probably embellish on in another trading lesson, and that is Position
Sizing.
Position Sizing is nothing more than varying you share
size on a per trade basis. It is similar to the way a professional blackjack player will vary his/her bet size, depending on the deck count. It is
this simple but incredibly important strategy that will allow you to be far more
successful as a trader.

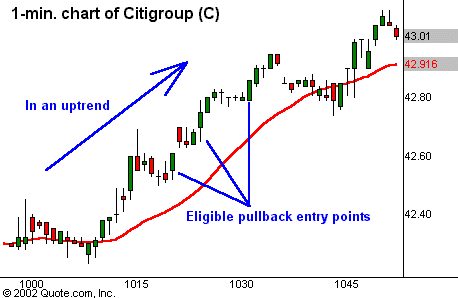
Notice on this chart of Citibank
(
C |
Quote |
Chart |
News |
PowerRating) on a 1-minute time
frame, I point out three potential entry points. If you took each trade, sold
out when the move ran out of steam, you did fine. However, let’s take a
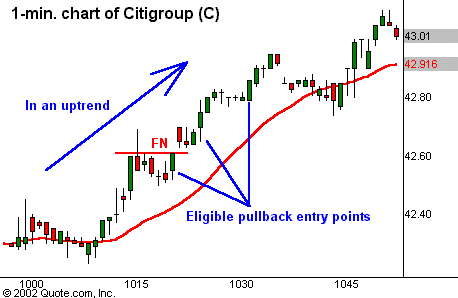
look at the second chart of C. This time, we see that there is a FN
at
$42.63. Suddenly my mind-set is much different. Not only will I still take
the trade to the long-side, in this case I tripled my share size. It is
this subtle or not-so-subtle adjustment that makes a big difference when the day
is done.

The setup in Veritas, on the surface, is one I
normally would not have considered, however, with the KTN I would take the
trade. However, given that I am still bucking the trend, my share size
would be reduced to reflect the fact it is not a “perfect” setup.
Nonetheless, I have now identified a trade that would have gone unnoticed
before.
The KTNs are really just an off-shoot of some work previously done
in order to identify potential support and resistance areas for a given
security. Some of them are arrived at by simple Fibonacci analysis, some
by old-fashioned chart work and some, well, let’s just rather not
say. What I found over the years however was that many times when I was
looking to place a trade, it would sometimes coincide with one of these
levels. It did not take long to discover that it added a very nice edge to
my trading and made a noticeable difference on my bottom line.
So let’s review:
1. Technical levels introduce to your trading style one more piece to
the trading puzzle, a piece that may just complete the puzzle.
2. The technical level may allow you to determine the appropriate
number of shares to trade.
3. The technical level may reveal a trade (like VRTS) that on the
surface you never would have considered.
I trust you have found this discussion helpful. Feel free to send me
any comments or questions.
For The Best Trading
Books, Video Courses and Software To Improve Your Trading
