Trading Contracted Volatility with Haggerty
From 1990 to 1997, Kevin Haggerty served as Senior Vice President for Equity Trading at Fidelity Capital Markets, Boston, a division of Fidelity Investments. He was responsible for all U.S. institutional Listed, OTC and Option trading in addition to all major Exchange Floor Executions. For a free trial to Kevin’s Daily Trading Report, please click here.
It has been a low volume week, and you should expect more of the same today in front of the long weekend, and liquidity will be thin as well. NYSE volume only topped 1.0 bill shares once this week, and the NYSE volume of 888mm shares yesterday was the lowest as the SPX made a new rally high and close at 1150.41 and 1148.46.
Trading in the major indexes has been slow because of the low volatility, and there is not much intraday travel range to take advantage of. However, when markets are not extended day traders can very often capitalize on contracted volatility strategies, especially in the first hour when things open in line.
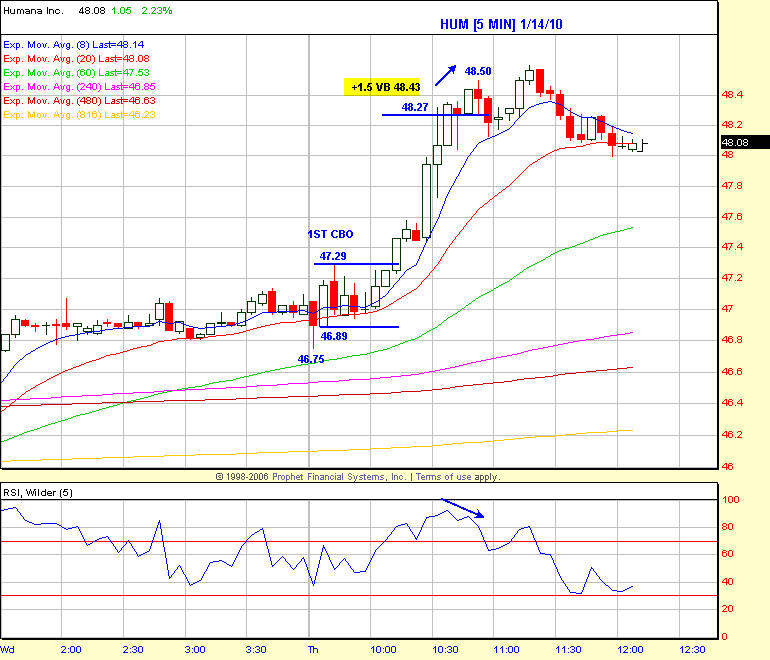
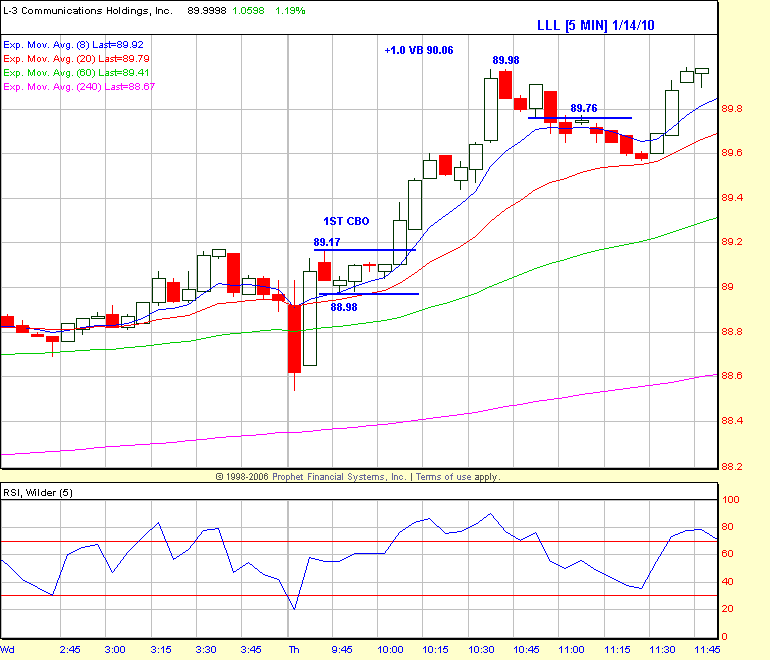
For example, yesterday, Trading Service Focus List stocks like ^HUM^ and ^LLL^ both formed the 1st Consolidation B/O’s to new intraday high strategy, and the entry levels above 89.17 for LLL, and above 47.29 for HUM were clearly defined, and above all of the EMA’s, so by my definition they were high probability trades. The HUM trade was exited into the +1.5 Volatility Band zone, and the LLL at the +1.0 Volatility Band zone, for a net gain of +1.4% on the combined trades. Before any stock, ETF etc is put on the Focus List it has to meet certain daily chart parameters which are outlined in the Trading Service, and can be read with a Free Trial Subscription.
The empty suits on CNBC were hyping the ^INTC^ earnings after the close yesterday, but the stock did nothing much in after-hours trading and is -2.3% as I complete this at 9:47AM. ^JPM^ announced this morning and is -1.8%.
In my last commentary for 1/13, I discussed the 1142-1146 and 1153-1164 key price zones, and also some time symmetry. Today is the .618RT in time, which is 218 trading days from the 3/6/09 667 low, following the 352 TD decline from the 11576 10/11/07 high (.618 x 352=218) Also, utilizing the Square of 9 using price (667) to measure time, it indicates that 1/22-1/23 is also a key time period, and the highest probability is a correction to at least the SPX 50DEMA before the index advances to the 1229 .618RT zone to 1576 from 667, where I will have exited 70-75% of the bull cycle long index proxy position bought in Feb/Mar 2009.
Have a good trading day!


Click here to find full details on Kevin’s courses including Trading with the Generals with over 20 hours of professional market strategies. And for a free trial to Kevin’s daily trading service, click here.
