Trading Opportunities in Non-Financial Futures Markets (Part 1)
There is an old adage which states “Both bad news and good news is always
good news for futures traders.” The reason is that as futures traders we can
take Short positions as easily as we can Long positions. Today, too many new
traders have chosen to focus exclusively on day-trading the E-mini stock index
futures and may have overlooked the non-financial contracts which created the
original futures industry in 1865. In fact, until Currencies began trading in
1972, all futures trading was confined to agricultural and mineral commodities.
[NOTE: this article will use the term “financial futures” to include
Currencies, Interest Rates and Stock Indices]
Today, the non-financial futures may comprise only 20% of all U.S. futures
trading volume. Nonetheless there are many exciting and vibrant markets to trade
— both with outright long or short positions and with intra-market and
inter-market spread positions. Is there a trader (or consumer) today who is not
aware that the price of Gold has tripled since the beginning of 2002 (from $270
an ounce to well above $900) or of Crude Oil’s rise from $50 a barrel one year
ago to almost $100 today!
Click here to order your copy of The VXX Trend Following Strategy today and be one of the very first traders to utilize these unique strategies. This guidebook will make you a better, more powerful trader.
But what of the agricultural futures contracts like Wheat and Sugar? A
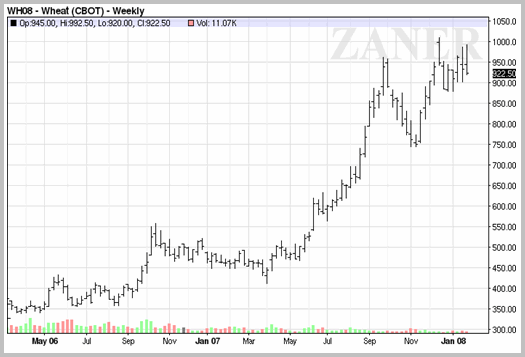
six-month bull market in wheat was followed by a 6-week bear market, only to
recover and make new all-time highs exceeding $10.00 a bushel. And Sugar
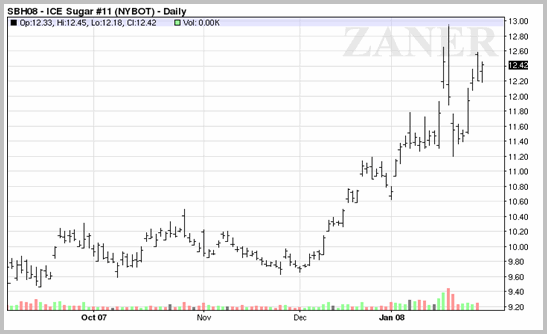
futures? The current bull market, which started in December 2007, has seen a
100% increase in the price per pound!

Daily bar chart for March 2008 Wheat Futures

Weekly continuation chart for Wheat, going back to April 2006

Short term traders may have interest in viewing the intra-day volatility in
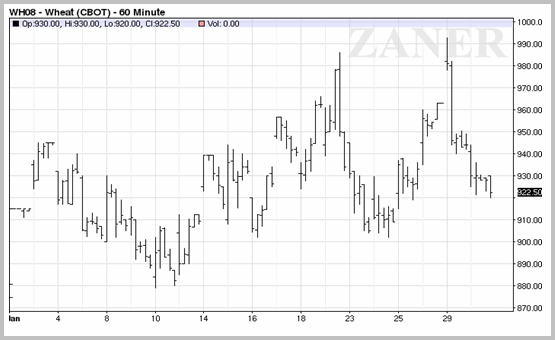
March Wheat, as seen in this January 30th, 60-minute bar chart.

Daily bar chart for March Sugar
Clearly there have been spectacular trading opportunities over the past six
months. So how does a trader make that transition from financial futures to
agricultural, energy and metal futures? Well, don’t abandon the ironclad rules
of “buy low and sell high,” and “buy high and sell higher” but there are
differences in the way these market sectors trade.
Fundamental vs. Technical Analysis
Speed of News and Special Release Dates
Anticipatory Markets and Realization Markets
Physical Delivery Concerns and the issue of First Notice Day
Storable Commodities vs. Nonstorable
Carrying Cost and Spread Relationships
Volume and Liquidity across the 24-hour trading day
Day-Trading vs. Position Trading
Daily Price Limits and Limit Up/Limit Down days
Specialized Managed Futures programs
Fundamental vs. Technical Analysis
For all futures markets, the fundamentalist has to focus on macro-economic
issues and then drill down to the nitty-gritty supply/demand analysis for a
particular commodity. To wit:
1. Has the demand for ethanol increased the acreage devoted to corn and how
has that increased the supply?
2. But will this new source of demand cause ranchers to compete with ethanol
plants for the supply?
3. And if corn gets too expensive will ranchers sell breeding stock today — thereby increasing the short-term supply while inadvertently decreasing future
supply — and will this affect calendar spreads for Cattle futures?
This overly simplified example illustrates the intertwined economics of
supply and demand among non-financial contracts.
There is a story we like to tell about a university’s attempt to build an
econometric model to forecast the price of Hogs. They gave up the quest because
the short, medium and long term variables and multitude of cause and effect was
too vast. Now granted this was back in the early days of computerization,
nonetheless it illustrates the degree of specialization needed to focus
exclusively on fundamental analysis.
But thankfully, the “rules” of technical analysis and trend following
techniques work just as well for Crude and Corn as they do for the Pound and the
S&P. So take heart and apply your Bollinger Bands exit and exit rules to this
traditional futures market segment.
Speed of News and Special Release Dates
Generally, the Secretary of Agriculture does not make pronouncements that
rock the trading world like those made by the Chairman of the Federal Reserve
System. Furthermore, orange juice trees planted in April do not yield fruit in
May. Our point being: Significant shifts in the supply and demand curves cannot
occur in the short-run. But as our freshman economics professor used to point
out, a shift in the curve is different from a shift up and down an existing
supply or demand line. Hence, we still get to trade exciting (and some
unprecedented) price movements which can take weeks or months until they really
get noticed and begin to take off.
Unlike the financials which face a daily spate of economic releases, the “Ags”
rely on monthly and quarterly reports. These often have a dramatic next-day
effect on the markets and intra-day gyrations get driven by a case of
expectations vs. the actual. The market anticipates a bullish report, a bullish
report is released and the market drops. Why? Because the report wasn’t as
bullish as the commercials had hoped for and traders were disappointed. Days
later, when calm and cooler heads prevail, the market resumes its upward course
as traders realize the true bullish significance of the report.
Anticipation Markets vs. Expectation Markets
Too many traders quickly forget another lesson from Economics 101: “Price is
the intersection of supply AND demand.” The reason is that it is relatively
easier to forecast (ie “anticipate) future supply than it is to gauge future
demand. Doomed traders “realize” (often after the market has made its move) that
the demand was greater or less than forecast. Let me illustrate with a basic and
once again, overly simplified illustration.
Every year the USDA polls farmers as to the number of acres they intend to
plant for corn. We have excellent data on the average number of bushels per acre
for every county in the U.S. and taking into account long term growing
conditions, we multiply the acres being planted by the average number of bushels
per acre and we arrive at the “anticipated” new supply. Add to this the amount
of corn held in storage facilities reduced by the amount of corn we expect to
use prior to the next harvest and we arrive at the anticipated future supply.
Compare this to a year ago and you have a pretty good idea whether the future
supply will be greater or less than in prior years. Too much corn? Then we
“anticipate” the greater supply will create a bear market. And prices start
their downward trend. But price is where the supply curve crosses the demand
curve and demand is just too often ignored. Why did corn prices rally when the
anticipated supply was so large? Often it is because unforeseen demand was so
much greater. “Ah ha,” traders say. “We now realize that the market rallied on
strong demand.”
This article was written by Larry
Schneider, director of marketing and business development for
Zaner Group. Larry has spent over thirty
years in the futures industry and likes to say he turned off the lights on the
old Egg Futures contract when the CME closed trading.
