TradingMarkets 7 Stocks You Need to Know for Thursday: DAL, YHOO, LLY, AMZN, BJ, TUP, BLK
For traders and investors following midcap stocks, the airlines sector were a source of strength in the form of the gains in stocks like ^JBLU^ and ^ALK^. Both stocks broke out to new short term highs on Wednesday.
Among the companies reporting earnings on Thursday are ^AXP^, ^CAT^, and ^T^. Down two out of three days ahead of its scheduled earnings announcement on Thursday are shares of ^SNDK^.
Special note: If you haven’t added exchange-traded funds (ETFs) to your stock trading, then click the link below to find out why more and more stock traders are adding ETFs to their portfolios in the latest interview with TradingMarkets CEO and founder, Larry Connors.
Trading ETFs by Mastering Probabilities.
Available now for free at Investor’s Business Daily. Click the link above to access the interview.
Here are 7 Stocks You Need to Know for Thursday.
Leading the airline group higher on Wednesday, shares of ^DAL^ soared by more than 10%. The close marked the stock’s first above the 200-day moving average since early August.
A two-day pullback in ^YHOO^ was enough to bring out buyers in Wednesday’s trading. Shares of Yahoo! gained 2% and continue to hold ground above the 200-day.
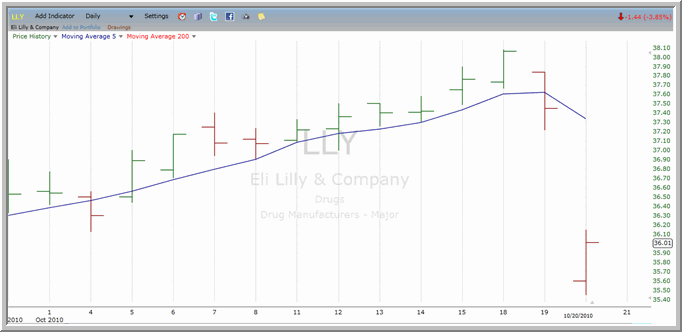
Trading near year-to-date highs only two days ago, shares of ^LLY^ pulled back by well over 3% ahead of trading – and a quarterly earnings announcement – on Thursday.

The pullback in LLY puts the stock at its most oversold levels since climbing above its 200-day moving average in early September.
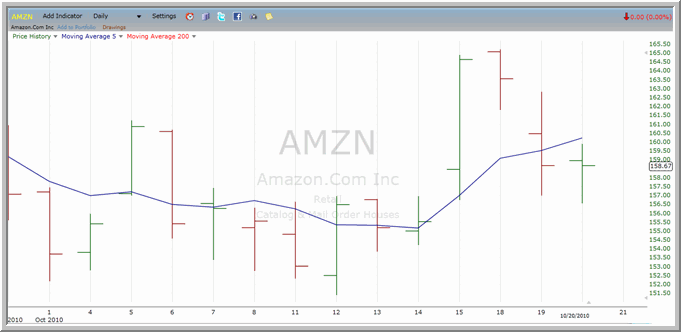
Also pulling back above the 200-day is ^AMZN^ (below). Amazon.com is scheduled to report quarterly earnings after the bell on Thursday.

Shares of Amazon.com have closed lower for two out of the past three days.
A three-day pullback in shares of ^BJ^ has put the stock at its most oversold level since mid-August.
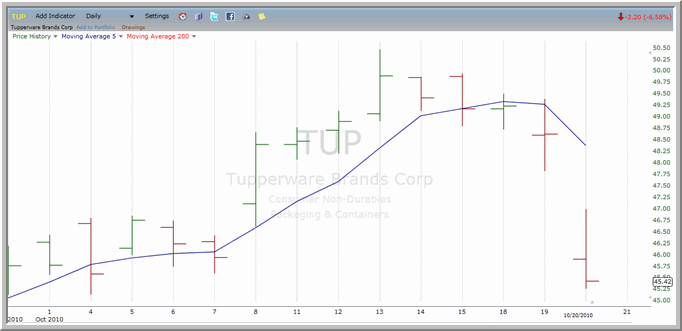
Down four out of the past five trading days, shares of ^TUP^ (below) have pulled back toward levels from which they have historically outperformed the average stock in the short term.

The stock spent virtually the entire summer trading below its 200-day moving average. TUP again closed back above that level and the end of September.
^BLK^ continued to move lower below the 200-day, dropping by nearly 3%. The stock had become overbought over the past week and have spent four out of the past five days closing lower.
Markets only move in three directions: up, down and side to side. Click here to learn why combining quantified mean reversion (pullback) strategies with quantified trend following strategies can be an excellent way for traders and investors to put money to work in all of all market conditions.
David Penn is Editor-in-Chief at TradingMarkets.com.
