TradingMarkets Chart of the Day
Today the Dow is nearing record highs. On TV, the
talking heads are all pushing this new rally and making bullish market calls.
However, our research has shown that traders should be
selling into highs and buying into lows! We have found a
significant edge in trading in a contrarian style. Buy low (weak) stocks
and sell high (strong stocks). This new high will become just that – an
apex on the chart directly preceding a fall.
For today’s Chart of the Day let’s take a look at the
Stocks Ready To Drop list published each day on the
Indicators
page. These are the stocks that today made new 10-day highs that are still
in an downtrend as they are trading below their 200-day moving average. They are
sorted in rank according to how over-extended they are vs. their 10-day moving
average. These are simple pullback trades: look for trending stocks to
move against their momentum, setting up a better price before the trend resumes.
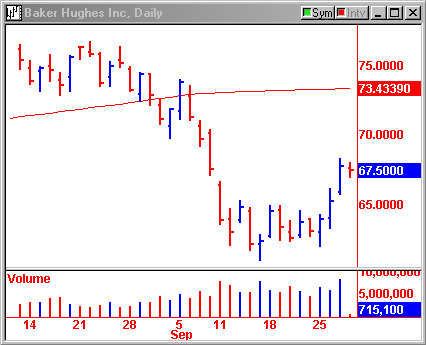
Baker Hughes
(
BHI |
Quote |
Chart |
News |
PowerRating) has
been trading below its 200-day moving average since early September. Over
the last two trading days, BHI has rallied nearly 5 points to move closer back
to its moving average. Watch for this rally to fail as the momentum of the
downtrend pushes stock price to move back in its original downward direction.

