TradingMarkets Chart of the Day
For today’s Chart of the Day, let’s take a look at the
Stocks Ready To Drop list published each day on the
Indicators
page. These are the stocks that today made new 10-day highs that are still
in an downtrend as they are trading below their 200-day moving average. They are
sorted in rank according to how over-extended they are vs. their 10-day moving
average. These stocks are pullback trades; use the trend gauge an entry
when the stock moves against its momentum.
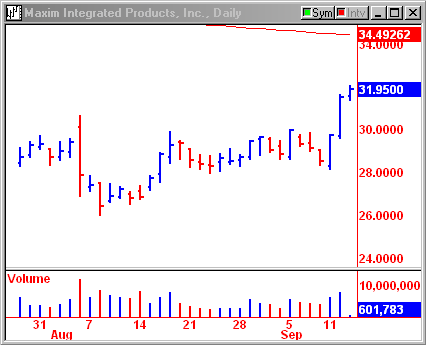
Maxim Integrated
(
MXIM |
Quote |
Chart |
News |
PowerRating)
has been in a confirmed downtrend since March, when price broke support and
began trading below its 200-day moving average. This is a weak stock.Â
Today, September 13, price is making new 1-month highs, pushing up towards the
moving average. Over the next few days, watch for this rally to fail, as
price resumes its downward trend.

Remember: Pullbacks are a great way to take advantage of your
knowledge of the trend. When price moves against the trend, prepare to
catch the reversion move.
