TradingMarkets Chart of the Day
For today’s Chart of the Day let’s take a look at the
Stocks Ready To Drop scan found on the
Indicators page. These stocks made new 10-day highs yesterday and
are still in a downtrend as they are trading below their 200-day
moving average.
As we have been learning over the last few weeks in this article, stocks that
make a move against the trend often resume trending after over-extending
price. This is what we love to call a pullback.
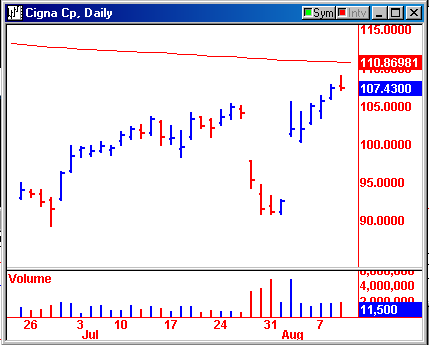
Cigna
(
CI |
Quote |
Chart |
News |
PowerRating) has been
trading below its 200-day moving average for some time now, confirming its
downtrend. On Wednesday, CI made new highs, pushing very close to the
key MA. After making multi-week highs, CI closed at the very bottom of
its range, signaling weakness in the move. Watch for CI to resume its
downtrend, as the weight of resistance from the 200-day MA should be enough to
get this stock moving in its trending direction.

Remember: Use pullbacks
to get a better price before the stock resumes its trend!
