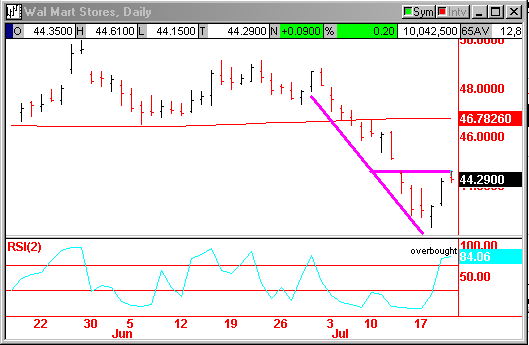
TradingMarkets Chart of the Day
Today’s chart of the day looks at pullbacks and how to use
pullbacks to find a good price on a short sell. The first thing to do when
looking for pullbacks on a chart is to identify the trend. Is the stock
trending up or down? One of the easiest ways to figure this out is to look
at the 200-day moving average, and then the 50-day moving average if necessary.Â
If price is above the 200-day MA, then the stock is trending up, and if the
price is below the 200-day MA, the stock is trending down. A pullback
occurs when price moves against the trend, giving traders a better buy-in price
before the stock resumes its original trend.Â
For short sell pullbacks, the stock must be in a downtrend and
make a move up towards the resistance at the moving average. Wal-Mart
(
WMT |
Quote |
Chart |
News |
PowerRating)
is in a steady downtrend right now, having started a downtrend in the early
parts of July. After breaking through support at the 200-day MA,
(
WMT |
Quote |
Chart |
News |
PowerRating)
has been in a solid decline before staging a bounce on 7/18. On 7/19 we
saw a continuation of the bounce, but on 7/20 we had a down day in which price
closed at the lower half of the trading range. Because this stock is in a
downtrend, we can view this bounce as a classic pullback. RSI is also very
over-bought, and for a stock well under its MA, this could mean big trouble for
(
WMT |
Quote |
Chart |
News |
PowerRating) over the next few days.

John Patrick Lee
www.TradingMarkets.com
