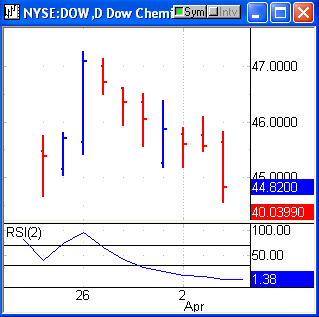
TradingMarkets Chart of the Day
These are stocks that have a 2-period RSI reading below 2 and
are trading above their 200-day
moving average. Our research
shows that stocks trading above their 200-day moving with a 2-period RSI reading
below 2 have shown positive returns, on average, 1-day, 2-days and 1-week later.
Historically, these stocks have provided
traders with a significant edge. To
learn more about our research into stocks that have a 2-period RSI below 2, and
how to use this information,
click here.
Watch for Dow Chemicals’
(
DOW |
Quote |
Chart |
News |
PowerRating) price action to potentially move back up over the next few days, as
the stock corrects itself back into the direction of the long term trend.

Use pullbacks to get a better price on your
buy-in.
