TradingMarkets Chart of the Day
For today’s Chart of the Day, let’s take a look at the
Stocks Ready To Drop list published each day on the
Indicators
page. These are the stocks that today made
new 10-day highs that are still in an downtrend as they are trading below their
200-day moving average. They are sorted in rank according to how over-extended
they are vs. their 10-day moving average. This is a simple pullback
strategy; look for stocks that are strongly trending to move back against the
trend, creating an opportunity for a better buy-in.
Labranche & Company
(
LAB |
Quote |
Chart |
News |
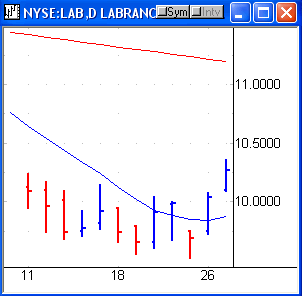
PowerRating) had traded up to its 200-day moving average (red line) back on
11/22/06, but was sent lower. On Wednesday LAB made a new 10-day high, in a rally upwards against the
downtrend. Watch for price to potentially move back down over the next few days, as the stock
corrects itself back into the direction of the long term trend.

Use pullbacks to get a better price on your buy-in.
Trending stocks give traders great opportunities for easy action.
