TradingMarkets Chart of the Day
These are stocks that have closed down for five or more
consecutive days and are trading above their 200-day moving average. Our
research shows that stocks trading above their 200-day moving average that close
down for five or more days have shown positive returns, on average, 1-day,
2-days and 1-week later. Historically, these stocks have provided
traders with a significant edge. To learn more about our research into stocks
that make five, or more, consecutive down days, and how to use this information,
click here.
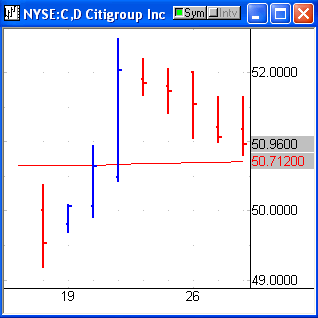
Citigroup
(
C |
Quote |
Chart |
News |
PowerRating) has been trading above its 200-day moving average for the past 5 sessions,
which looks to be the start of a new uptrend. Watch for price to potentially
move back up over the next few days, as the stock corrects itself back into the
direction of the new trend.

Use pullbacks to get a better price on your
buy-in.
