TradingMarkets Danger Zone
Two key changes have helped change one of the most popular technical indicators into one of the best tools for short-term stock traders.
How do you know when a stock has moved “too far too fast”? The trading shorthand for such a condition is to refer to a stock as overbought. But anybody who has traded for any length of time knows that what is typically considered to be overbought by most observers is simply not adequate for the purposes of traders making real bets on the direction of stocks.
As I have noted elsewhere, the vast majority of oscillators–the technical indicators that measure overbought and oversold conditions–tend to be far too generous in the stocks they call both overbought and oversold. The consequences for traders who follow these traditional indicators in the traditional fashion can be devastating. What, after all, is a bull market other than a market that become overbought and stayed overbought for longer than anyone expected?
Here’s just one example of how traditional indicators used in the traditional fashion can be a problem for traders. The exchange-traded fund, GLD, became overbought as of the close on February 21st at 93.25. If a trader, believing that GLD had moved “too far too fast,” had decided to sell GLD short based on its overbought condition, just how much profit–or pain–would this trader have experienced?
Let’s put it this way. By the time GLD was no longer officially overbought, the stock was trading at 95.95. And this was after the ETF has rallied to as high as 98.15!
So blindly betting against stocks–or ETFs–simply because a traditional technical oscillator says that the stock is overbought is hardly a winning strategy. But does that mean that we cannot use the concepts of overbought and oversold markets to help guide our trading?
Of course not. But traders must do what we did: reconfigure the oscillators so that they (a) focus on short-term price action and (b) have a threshold for overbought or oversold that is extreme enough that when a stock becomes overbought or oversold the stock truly has gone “too far too fast.”
Our “re-invention” of the Relative Strength Index is an example of the sort of optimization that can make an ordinary technical indicator an extraordinary one. And we went to work to address both of the issues I just mentioned. First, we “shortened our swing”, changing the parameters of the RSI from 14-periods to 2. This focused the indicator on short-term price action alone.
Second, we changed the levels at which markets would be considered overbought and oversold. Whereas the traditional RSI called a market overbought at 70 and oversold at 30, we changed those levels so that a market was not overbought until it reached 98 or higher and was not oversold until it reached 2 or lower.
You can imagine how many fewer stocks would make it beyond these much more discriminating levels. More than that, you can also see how those stocks that do fall below 2 in the RSI or rally above 98 are among the most oversold and overbought stocks in the market. These are the stocks that traders looking to trade oversold and overbought conditions want to focus on.
Click here to read our research into trading stocks using the 2-period RSI.
We add one final parameter before we are ready to go stock hunting: we are only interested in oversold stocks that are strong stocks, trading above their 200-day moving averages, and we are only interested in overbought stocks that are weak stocks, trading below their 200-day moving averages. We have found that there simply is no edge in trying to bet against strong, overbought stocks nor in betting in favor of weak, oversold ones.
Below are four stocks that have found themselves in the TradingMarkets Danger Zone. These are stocks that may have moved too far too fast and are now dramatically overbought based on our improved, 2-period RSI. Note also that all of the stocks listed have Short Term PowerRatings of 3 or less.
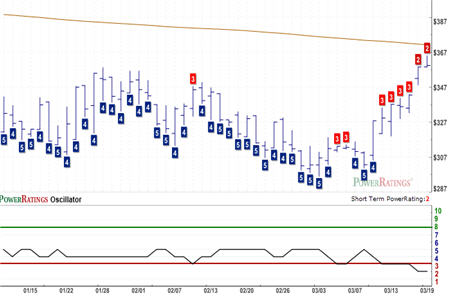
Alexander’s
(
ALX |
Quote |
Chart |
News |
PowerRating). Short Term PowerRating: 2. RSI(2) 98.01
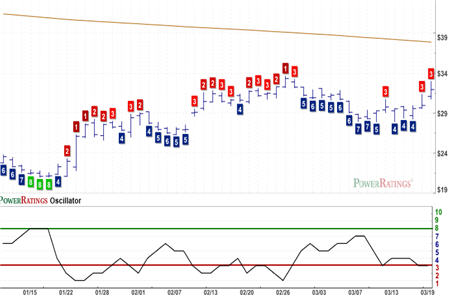
Darden Restaurants
(
DRI |
Quote |
Chart |
News |
PowerRating). Short Term PowerRating: 3. RSI(2) 98.21
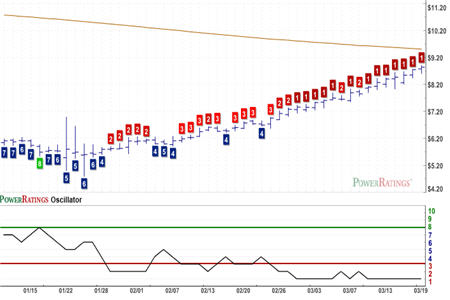
Micrel
(
MCRL |
Quote |
Chart |
News |
PowerRating). Short Term PowerRating: 1. RSI(2) 99.84
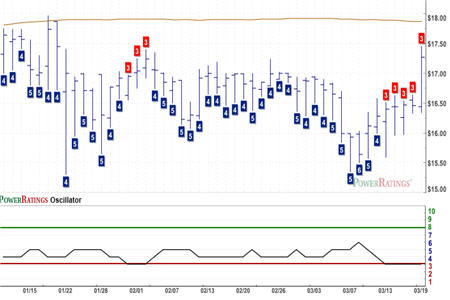
Warner Chilcott
(
WCRX |
Quote |
Chart |
News |
PowerRating). Short Term PowerRating: 3. RSI(2) 98.95
If you are looking to take your trading to the next level, then consider grabbing a copy of our special, Free Report on short-term stock trading: “5 Secrets to Short Term Stock Trading Success.” This report will clue you in on the most important principles and best practices that short-term traders have used in order to make money from the inefficiencies and mispricings that appear in the stock market every day. Click here to get your copy of “5 Secrets to Short Term Stock Trading Success” or call us today at 888-484-8220.
David Penn is Senior Editor at TradingMarkets.com.