Try This Helpful Exercise
After
two up days on the most volume since November,
the
(
SPY |
Quote |
Chart |
News |
PowerRating)s had a gap up narrow-range
day with the entire range above the previous day’s range. The volume was only 39
million vs. the previous two days of 58 and 60 million. They closed at 85.63,
+1.7%, and just above the 20-day EMA of 85.52. The 50-day EMA is up at 87.63, in
addition to the head-and-shoulder neckline at 87. Yesterday was the first
retracement to the 20-day EMA since it crossed below it on Jan. 17. That now
becomes a possible downside pivot. Certainly part of the volume decline
yesterday was due to the weather as many didn’t make it into the city, but we
can’t know how much.
Overall, NYSE volume was
1.17 billion, with the volume ratio one-sided at 87, and breadth the same at
+1387. The gap openings were not unexpected on a day like yesterday, but nothing
really came in after the early move up. There were no real pullbacks to trade.
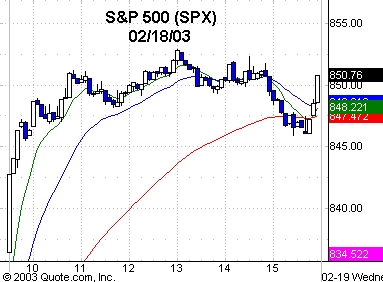
After that, the major indices went sideways for the entire day, with the
exception of an SPY herky-jerk one-half-a-point move down at 3:00 p.m. ET, only
to reverse back up in the last 10 minutes. No surprise on that.
The SPX
(
$SPX.X |
Quote |
Chart |
News |
PowerRating)
closed at 851.17, with the 20-day EMA at 851. The
(
QQQ |
Quote |
Chart |
News |
PowerRating)s, which have been
the better performer of late, closed at 25.25, above its 89-day EMA of 25.14,
its 50 at 25.02, and its 20 at 24.63. The .618 retracement to the last swing
point high of 27.47 is 25.88, with yesterday’s high at 25.34. This has been a
good reflex off of the exact .786 retracement to the October lows by the
SPX, Dow
(
$INDU |
Quote |
Chart |
News |
PowerRating) and
(
SMH |
Quote |
Chart |
News |
PowerRating)s, while the QQQs bounced off the .618
retracement level.
The entries at these key
levels, and there was enough of a profit cushion at day’s end to carry the
positions into the next day. Now after the two-day reflex, they bring the drones
out of the closet with all of the oversold talk, short covering, market is
fairly valued, etc. Where were they before that? The best in typical doublespeak
in the media is, and I quote, “They rallied because Iraq might have a peaceful
solution.” But excuse me, the last rally day or so they said it was because it
looked like there was an imminent war and that would clear the air with a swift
victory or whatever. The media and Wall Street cliches are dangerous to your
pocketbooks if you listen, and worse, act on them. Most all of them are
completely contradictory and mutually exclusive.
A fun little exercise
that will help your trading and keep you focused on what is and not what should
be according to the media is to keep track of this nonsense on a daily basis. On
one side of your sheet, put just a sentence on what happened, and on the other
side, write down why it happened as per the media and some of the lightweight
drones they drag on to CNBC. You will get things like, and I quote, “The bond
market sold off because the stock market declined.” And a day later, they tell
you that “The stock market decline was caused by falling bond prices.” Hello?
Another favorite of mine
is the, and I quote, “The major indices anticipated higher interest rates, so
they declined.” And then you get, “The market advanced because it sees higher
interest rates as a sign of a strengthening economy.” It’s amazing, isn’t it? It
goes on and on, so try it for a while, and you will see that it improves your
objectivity and you’ll watch the idiot box less.
After the last three
days, you are obviously ready to trade in either direction, mostly because there
has been a retracement to some declining moving averages. For example, the SMHs
closed at 22.98, which is also its 50-day EMA, with the 89-day EMA at 23.87. I
use these moving averages simply as reminders to pay attention to how a stock
trades into and around these levels. These are levels where much manipulation is
attempted by professionals as they try to force the Generals and unsavvy
upstairs traders to accelerate their entries because they’re still stuck on
Edwards and McGee.
On a pullback basis, you
must be aware of the intersection pullback between Thursday’s high and Friday’s
low to see if any buying comes in. On the shortside, you start with moving
averages as possible downside pivots to key off, in addition to the closing
ranges. As I have said frequently, the second breakout entries above or below
the previous day’s high or low are a smarter way to go.
Have a good trading day.

Five-minute chart of
Monday’s SPX with 8-, 20-,
60- and 260-period
EMAs

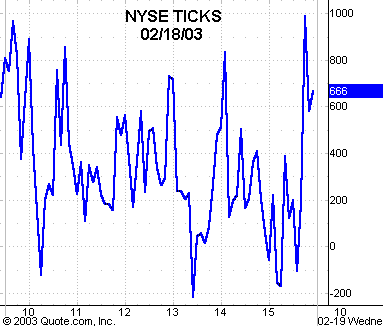
Five-minute chart of
Monday’s NYSE TICKS
