Try This Pattern In Your Own Trading
When the market is
strongly trending like today, you can have an excellent breakout play.
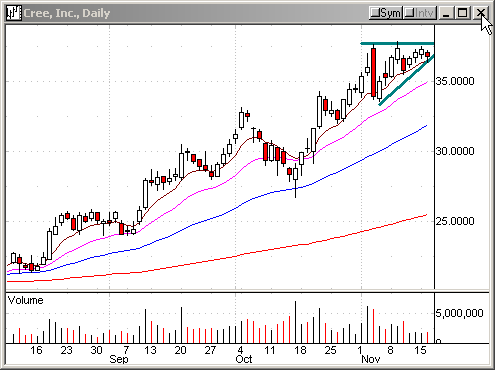
Look at the daily chart of Cree Inc (CREE) below (as of yesterday close).
The stock is trading above its 8-, 20-, 50-, and 200-day EMA. It is, needless to
say, in a strong uptrend. Also notice, CREE is forming an ascending triangle.
Naturally, we are looking to buy the stock as soon as it breaks above the top of
the triangle.

09:40:55
(From TradersWire)
Cree Inc (CREE)
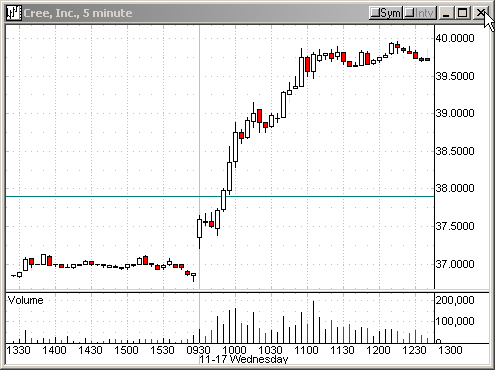
is trying to take out a resistance line on its daily chart. Long CREE if it
trades above 37.88. Target is near 40. Risk one point , or place a stop just
below the 8-day EMA (36.70). CREE is trading at 37.56, up 0.76.
Shortly after the alert, CREE broke above 37.88,
and around 12:15 PM, it reached our target. It always helps to trade in the same
direction as the market.

Have a nice afternoon session!
Feel free to mail me your questions.
Â
