Tuesday’s Stock Watch
The major averages turned
in negative performances for the week, as the NYSE and Nasdaq put in
two days of distribution a piece (only one clear for the NYSE). Disappointing
earnings and economic news have put the bears in control, as ongoing tensions
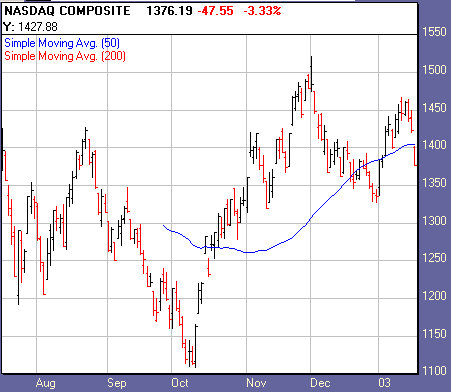
with Iraq and Korea add to the air of caution. The three major averages are now
trading below their 50-day moving averages, and from the weekly charts, it is
clear that price action has once again turned south at the trend lines.
Market breadth remains mostly stagnant. New 52-week
Highs and Lows continue to produce relatively low numbers, while the Highs list
maintains a slight edge over the Lows. Mark Boucher‘s
Top
RS and ER List turned in a surprise bullish session Thursday, with a reading
of 20. The
Bottom RS and ER List remains nearly non-existent.
Stocks from our watch list put in distribution days
for the week, though held ground. Remember, we’re only looking for stocks meeting
our top technical and fundamental criteria as taught in our
intermediate-term online trading course. The search goes on!
From Friday’s action:
Market breadth was negative, with NYSE
declining issues over advancing issues by a ratio of 1.94, and down volume over
up volume by a 3.19 ratio. Nasdaq declining issues over advancing issues came in
at 2.03, and down volume beat up volume by a 4.91 ratio.
Dow Jones Industrial Average
(
$INDU.X |
Quote |
Chart |
News |
PowerRating)
closed -1.27%
at 8,586.74. The S&P 500
(
$SPX.X |
Quote |
Chart |
News |
PowerRating)
closed -1.40% at
901.78.
The Nasdaq
(
$COMPQ |
Quote |
Chart |
News |
PowerRating) closed -3.33% at
1,376.20.

1,013
1,072
Declining Issues
2,071
2,139
320,646,000
158,799,000
984,685,000
1,342,150,000
Total
Volume
1,318,160,000
1,628,234,000
Highs
11
15
5
4
Top sectors:
Fiber Optics, Internet, Computer Security, Telecoms, and Gold
and Silver.
Watch List Action:
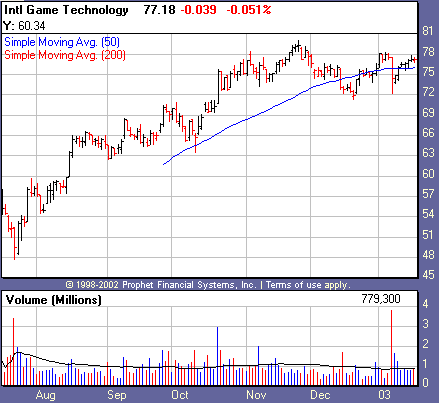
From our "breakout" list, and now in a base, International Gaming Technology
(
IGT |
Quote |
Chart |
News |
PowerRating)
appears as though it may break out again. After putting in a major day of
distribution on 01-08, the stock has crept up to recover the loss. If the stock
does break out, it is not considered an ideal buy due to the small and
choppy pattern.

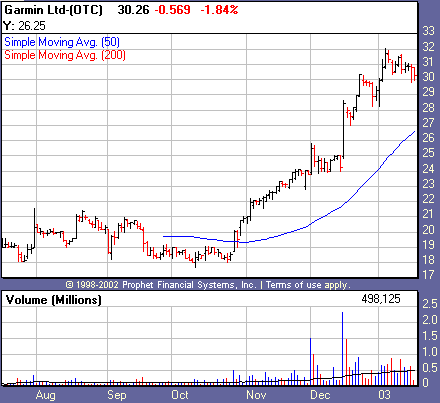
In a pullback, Garmin Ltd.
(
GRMN |
Quote |
Chart |
News |
PowerRating) has given off red flags in the form of
four distribution days made in the past two weeks. This is not what we want to
see going forward, so be sure to hold on to any profits.

Recent Breakouts
size=2>We monitor the action of Recent Breakouts as an indicator of
the market health for IT traders. When breakouts are acting well, this is a good
sign for the likelihood of further sustainable breakouts. When breakouts are
failing, IT traders should be even more cautious.
| color=#ffffff size=2>Company Name | color=#ffffff size=2>Symbol | color=#ffffff size=2>12 Month RS | color=#ffffff size=2>Price | color=#ffffff size=2>Price Change | color=#ffffff size=2>Average Volume | Pivot | 52-Week High |
Coach Inc. | ( COH | Quote | Chart | News | PowerRating) | 88 | 30.26 | -0.87 | 872,300 | 28.35 | 35.70 |
Garmin Ltd. | ( GRMN | Quote | Chart | News | PowerRating) | 95 | 30.26 | -0.57 | 404,400 | 23.46 | 31.35 |
Hovnanian Enterprises | ( HOV | Quote | Chart | News | PowerRating) | 84 | 33.29 | -1.01 | 597,000 | 33.56 | 40.56 |
International Game Technology | ( IGT | Quote | Chart | News | PowerRating) | 87 | 77.18 | -0.04 | 869,800 | 66.70 | 80.10 |
Stocks Forming a Handle
| color=#ffffff size=2>Company Name | color=#ffffff size=2>Symbol | color=#ffffff size=2>12 Month RS | color=#ffffff size=2>Price | color=#ffffff size=2>Price Change | color=#ffffff size=2>Average Volume | Pivot |
Expedia | ( EXPE | Quote | Chart | News | PowerRating) | 85 | 66.19 | +0.88 | 2,432,900 | 78.72 |
Apollo Group | ( APOL | Quote | Chart | News | PowerRating) | 84 | 42.87 | -0.69 | 2,258,700 | 46.57 |
Stocks Building A Base
color=#ffffff size=2>Company Name | color=#ffffff size=2>Symbol | color=#ffffff size=2>12 Month RS | color=#ffffff size=2>Price | color=#ffffff size=2>Price Change | color=#ffffff size=2>Average Volume | Pivot |
None |
href=”mailto:danielb@tradingmarkets.com”>danielb@tradingmarkets.com
If you are new to the "IT" strategy, be sure to
take a look at our
intermediate-term online trading course.
Intermediate-Term Traders
Report is posted on
Tuesdays and Fridays. For other intermediate-term commentary, be sure to read
Mark Boucher (Fridays),
Tim Truebenbach (Tuesdays and Thursdays), and
Gary Kaltbaum (Mondays and Thursdays).
