Two Ideas: One Stock And An E-Mini Play
Let’s look
at a daily stock setup and some action in the
E-mini S&P 500
(
ES03H |
Quote |
Chart |
News |
PowerRating) today.
First, let’s look at the daily long set up in Apple Computer
(
AAPL |
Quote |
Chart |
News |
PowerRating). On the
daily chart below I see the following:
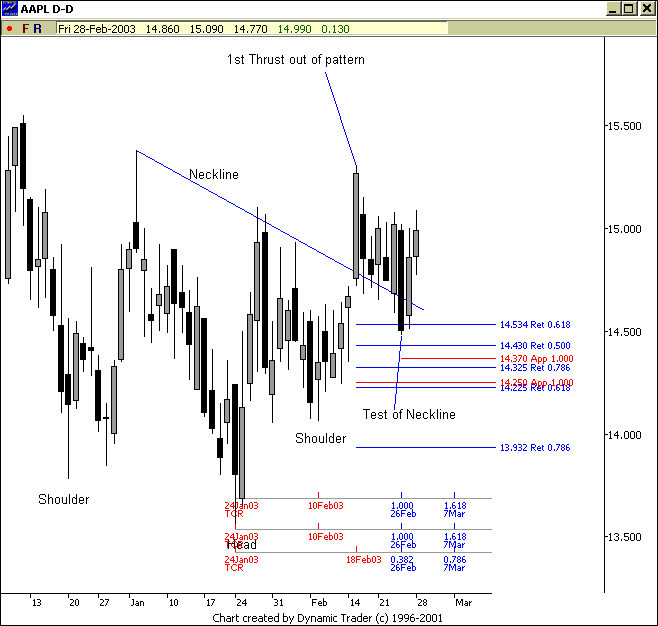
1) Inverse H&S pattern
that has completed.2) Price rallied above the neckline and has come back to test the neckline
3) In the process of testing the neckline (AAPL) has hit a Fibonacci price
support zone from 13.93-14.53.4) Within this price support zone is a Triple Crown Zone for a long set up.
5) We have two focus time cycles to look at. The first one is at Feb.
26. This is the day that (AAPL) found a bottom this week and has rallied the
last couple of days. If we do go lower the next date cycles for a possible
reversal to the upside would be around March 7.

I’m actually
long this stock as of today based on these items. My stop is below 13.93. So
let’s see if this Apple can move up for us.
Next, let’s
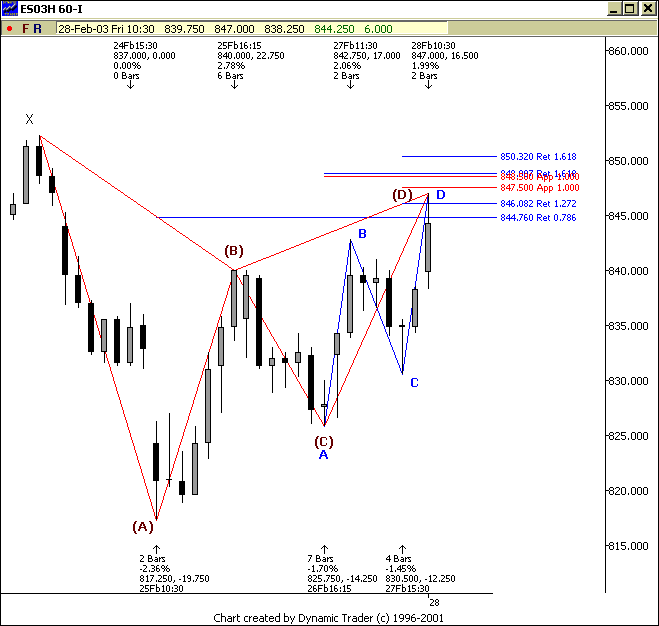
take a look at (ES03H) 60 minute chart. What you see below is what I have talked
about many times in this column. Yes, it’s a Bearish Gartley pattern. As price
opened and rallied with force up to our zone it was very intimidating to consider
a short trade.

Now, here’s
how it went down the rest of the day:
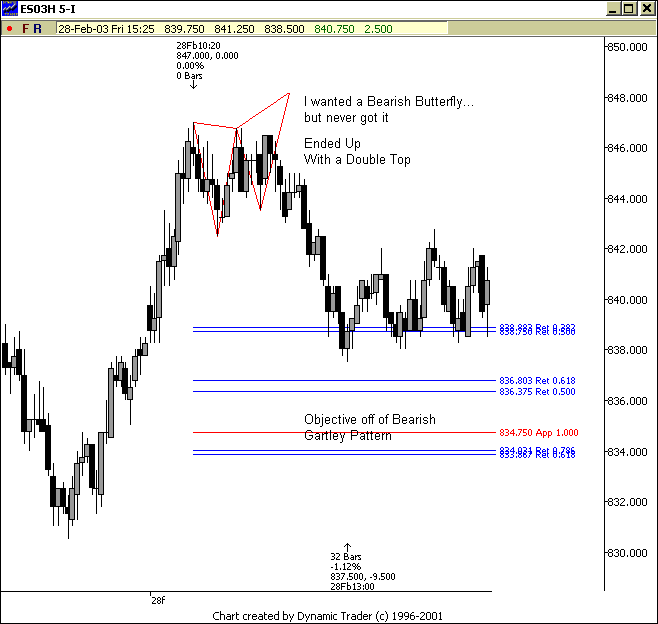
1) I saw a possible Bearish
Butterfly Pattern on the 5-minute chart that I was going to use as a short
trigger. Well, like my mamma always said “You don’t always get what you want, Derrik!"2) We ended up with a double top and had a very nice 9 point sell off from
the 60-minute chart pattern completion level.3) My target was down around 834-835. We didn’t make it there. Going into
these geopolitical-news-driven weekends, I would not take home a short based
on a 60-minute chart.

Have a great
weekend!
