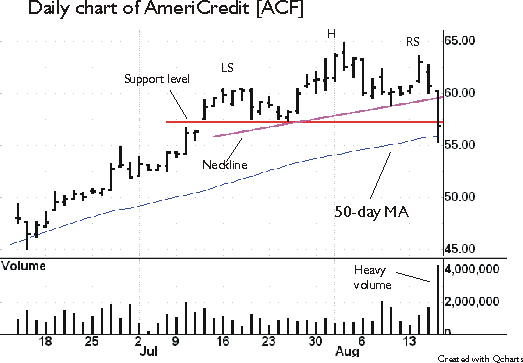
Two Major Violations
Two unnerving things
happened to the holders of AmeriCredit Corp (ACF)
yesterday (8/16/2001). It broke down below its support level and its neckline.
As you can see on its daily chart below, transaction volume was extremely heavy,
nearly four times its daily average. A big decline with heavy volume is normally
a sign of continuation of a selloff.
Another interesting point is that I can calculate the downside target price for
the stock because it is forming a head-and-shoulders pattern. First, you need to
measure the distance from the top of the head to the neckline. Then subtract the
result from the breakdown point. (See calculation below.)Â
64.90 – 58.19 = 6.71 (The distance from the top of the head to the neckline.)
59.50 (breakdown point) – 6.71 = 52.79 (target price)
Now, let’s see the five-minute
intraday chart from today’s session. (The red line shows the level of
yesterday’s low.)
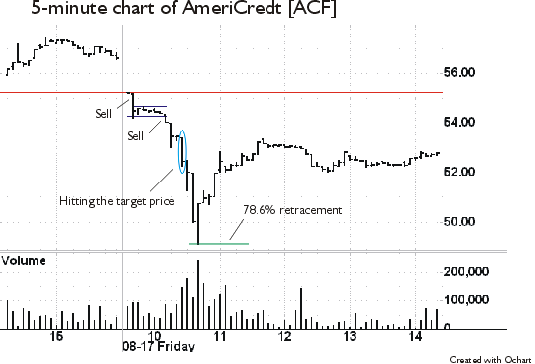
Our first sell opportunity came
shortly after the open when the stock fell below yesterday’s low. Around 10:10
a.m., ACF broke down below its channel. This was the second selling point. About
15 minutes later, the stock hit the target price of 52.79, but the selloff
continued until the 78.6% retracement level of the June 14 low to the August 2
high was reached at 10:40 a.m.
As I said earlier, ACF violated two important price levels on significantly
heavy volume. Truly, multiple signals are better than one.
Have a great weekend,