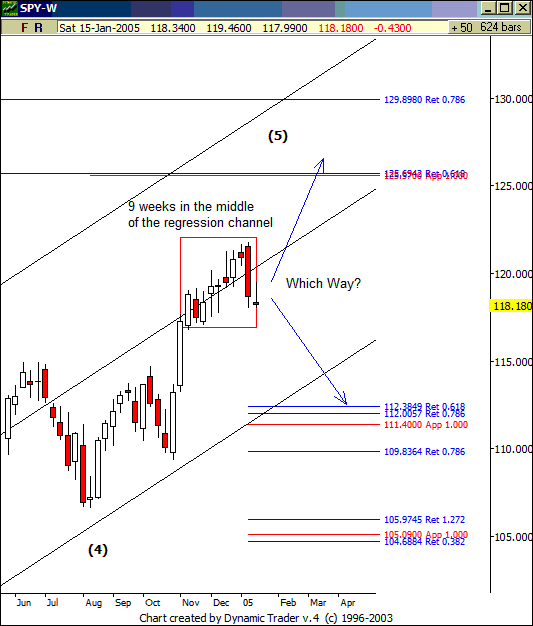
Two Possible S+P Scenarios
Which Way?
The S&P 500 SPDRs have been
floating in the middle of its uptrending regression channel for 9 weeks now.Â
Based on the analysis of the weekly chart of SPY below I have two scenarios:
Scenario 1: SPY FLY
The index get’s traction right
here and extends up into a Fibonacci extension zone from 126 to 130, where it
will meet resistance and the top of the regression channel that will act as
resistance. This is where price stops for the year. Also note that I have (5)
printed up in that zone. That 5 represents the 5th of 5 waves up
since 2002. That would mean we have a very likely multi-wave correction south in
order. So “SPY FLY†says early rally, then late year sell off and go no where.
Scenario 2: SPY DIE
The index does an early year
sell off to the tune of 10-15% to hit the bottom of the regression channel (that
is in an uptrend), and also hit a big Fibonacci price support zone. This would
likely be the extent of the early year pain, and traders find long trading
opportunity down in this 105-112 zone.

Oh I can hear you folks now….
“Thanks Hobbs…so you’re telling me the market could go up or down from here?!â€.Â
That’s exactly right. Now that you’ve made your 6th grade observation
let’s take it a step further. I’m saying, It’s not a great trading zone right
here. I’d rather be up in the 125-130 zone or the 105-110 zone to get
aggressive.
Have a great night!
Derrik
