Two Scenarios For Bonds
Well, after some time out of pocket, it’s good to be back in action.
I’ll be coming at you three times per week going forward. So if you’ve been
looking for some Fibonacci opportunities, you’ve found a home.
I want to focus on the US 30 Year Treasuries
(
US03M |
Quote |
Chart |
News |
PowerRating). There are two
scenarios developing here that we need to be aware of. In fact, there are a
couple of conclusions from these scenarios that we must also touch on, after
we’ve developed the plan.
Scenario 1: Bearish
Gartley
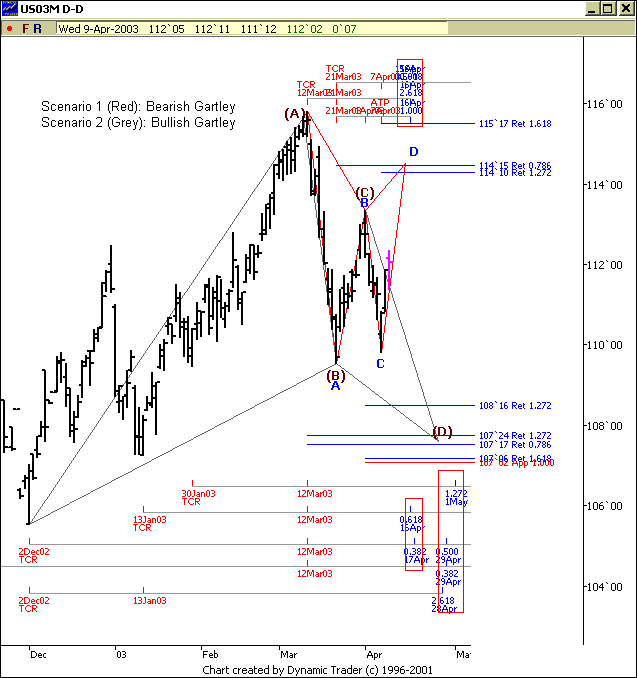
On the chart below, let’s play out a
scenario where bonds continue to move northbound. In fact, I have outlined in
RED if it continues going up this contract will
complete a Bearish Gartley pattern into a price resistance zone at 114`15. There
are three time cycles coming into play between April 15 and April 16
as well. With pattern, price and time cycles I would be looking for short
opportunities. Basically, I need price to come up and hit the 114 area to
complete my pattern. Then I’m looking on the short side.

Scenario 2:
Bullish Gartley
Now, on the chart above (highlighted in
GREY) we would have a Bullish Gartley complete down at the 107`17 area, if bonds
turn south and make a move to our Fibonacci price support zone from 107`02 to
108`16. Also interesting to note are the four time cycles that converge around
April 28 to May 1. Ideally, price would slowly trend down to price support and
hit our FibZone into these time cycles. In that case, I would be very interested
in long trading opportunities.
Regardless of the scenario that plays out, there are two items to think about:
-
Big Trading Range: With
Fibonacci price support and patterns developing above and below, it looks like
we have a very well-defined trading range that could last for quite a few
sessions. If these Fibonacci price zones are broken, I would vote for a
continuation of the move in whatever direction is broken first. (i.e., pushing
through resistance indicates an upward acceleration would be in order)Â
-
Equity Inversion:
Remember, whatever scenario develops, the equity markets will
most likely act inversely. So this is a critical chart to keep on my desk and
incorporated into my plan, whether I trade bonds or not.
Have a great evening!
Â
