Two Sectors To Focus On
The
Oil Service
Index (OXH) and the Semiconductor Index (SOX.X) are both at critical weekly
Fibonacci decision levels. Knowing these price decisions will be integral to
creating a trading plan whether trading the HOLDRs, (OIH) or (SMH), or trading
individual stocks within these sectors.
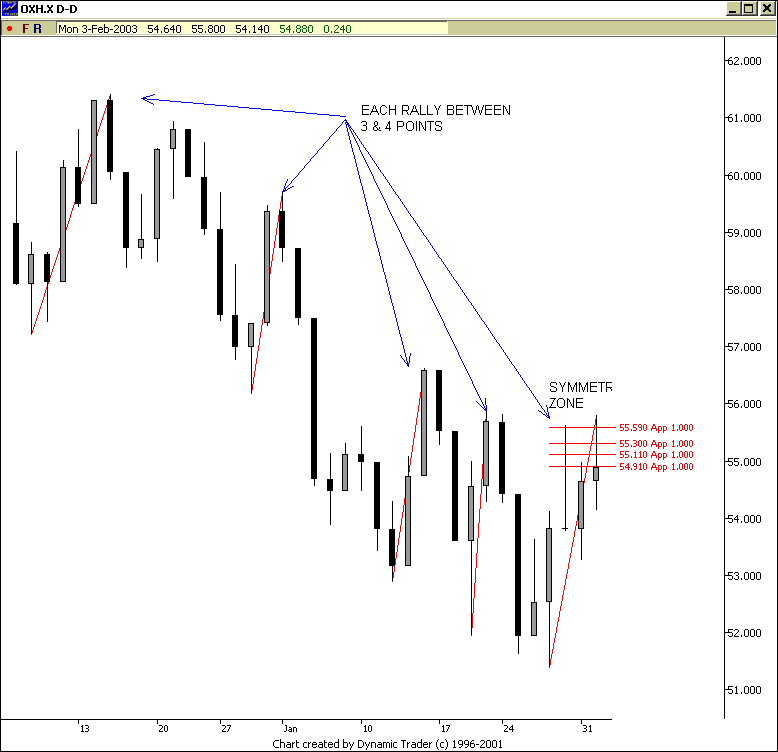
First, let’s look at the weekly
and daily
charts of (OXH) below: On the weekly chart we have a very nice looking time
symmetry move down that occurred over the last eight weeks. Notice the candlesticks
for each of the last three weeks. Check out how price traveled down to our Fibonacci
support zone, checked out the landscape and reversed back up, leaving three
consecutive weeks of “tailing/shadowing” price action. I’ve heard people draw
similarities to a search party being sent out ahead of the group to check things
out and come back to report their findings. Anyway, with time symmetry (eight-week
corrective declines), Fibonacci price support, and the candlestick action into
our price support zone, this could turn into a potentially nice long swing trade.

However, before
I can get too excited about a long trade, I check out the view from the daily
chart. Below you can see that we have had a number of sharp corrective rallies
over a few trading sessions that last anywhere from 3 to 4 points then roll
over. If I project the size of these rallies from the current swing low, I have
a “symmetry zone” that will provide me with tons of feedback. When this symmetry
zone is decisively broken, this tells me the immediate downtrend is broken,
and the weekly chart is starting to impact price action. Watch these levels
and consider creating your trading plan around them.
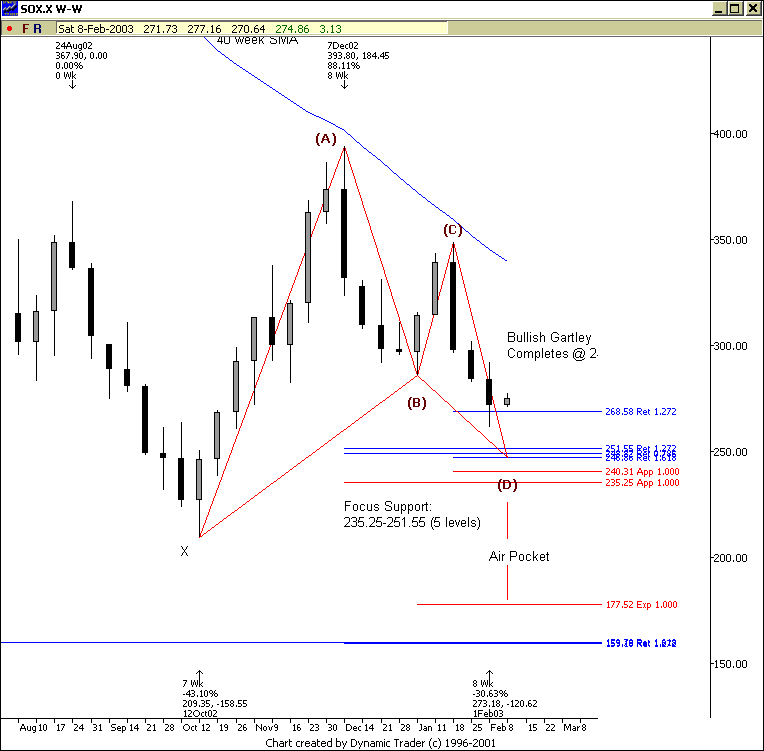
The other index
that is looking very interesting is the Semiconductor Index ($SOX.X) Check out
the weekly chart below: Here we are working on a two-step pattern into support.
The two steps are AB and CD. Ideally this pattern touches down between 235 and
250. In fact, if we make it down to that area of price support, we will complete
a Bullish Gartley pattern. This is an extremely critical decision for the SOX.
Let’s say this price support can not hold up the sector. Where is the next stop?
Based on my Fibonacci price analysis, the next stop would be down around 177
if the 230 range is broken. That’s what I call an Air Pocket. Don’t forget to
take your Beano ® if this happens.
Two sectors
dealing with incredibly important price support decisions.
*Side note: These
are times when trading the HOLDRs (OIH) or (SMH) may make sense as the “individual
stock” volatility and risk is reduced. One thing in this business we do have
a high level of control over is risk exposure.
Have a great
night!