Up for the Down Stroke? 5 Overbought Stocks for Traders
What’s better than a market that is down big in the pre-market, opens low and closes up for the session?
So far today, we are seeing what is better: namely, follow-through. After yesterday’s rollercoaster ride that saw pre-market futures down more than 2% and the session itself actually close up a few points (in the case of the Dow, for example), traders could not have been better rewarded by the session that followed, with the Dow up more than 275 points by mid-day.
But, as I’ve said before, traders need to be a little bit like party-goers who, while celebrating the festivities, are also keeping one eye on the exits. In the same way that traders need to be thinking about buying when markets are falling, traders also need to be making plans to sell when markets are rising.
There are a number of clichés and truisms that emphasize this–from “zigging while the other guy zags” to “when they’re cryin’ you should be buyin'”–but all of them support this idea which is critical, in our opinion, to success as a short-term stock trader: buying weakness works. Selling strength works.
How do traders accomplish this? There are two tasks for the buyer of weakness and the seller of strength. The first task is to determine what characterizes weakness and what characterizes strength.
For us, this task has been made very simple and straightforward: we use the 200-day moving average. Stocks that are trading above the 200-day moving average are considered to be generally strong. Stocks that are trading below the 200-day moving average are considered to be generally weak.
The second task is to figure out when strong stocks can be bought and weak stocks sold. We use a number of indicators–16 of them to be specific–in order to help us spot strong stocks experiencing temporary weakness and weak stocks experiencing temporary strength. Today, of those 16, I wanted to focus on stocks that were up by 10% or more in five days or less.
It isn’t risky to say that a stock that is up 10% in a short period of time is likely a dangerous stock to own–however exhilarating the ride higher might have been for a trader or active investor fortunate enough to own the stock before it began its ascent. Most traders have the experience of owning a stock that rocketed higher in a short period of time, failing to take profits, and seeing that stock reverse and begin moving downward as aggressively as it had been advancing.
But that risk increases significantly if that stock which is up 10% in a five or fewer days is also below the 200-day moving average. In this instance we have the combined challenge of a stock that is moving unsustainably “too far too fast” with the problem of a stock that is under significant selling pressure–as witnessed by the stock’s trading below its 200-day moving average. These are stocks that our research into short-term stock behavior going back to 1995 tells us are likely to underperform going forward. They are stocks that traders should avoid or sell short.
Click here to read our research into trading stocks that are up–or down–by 10% or more in five days or fewer.
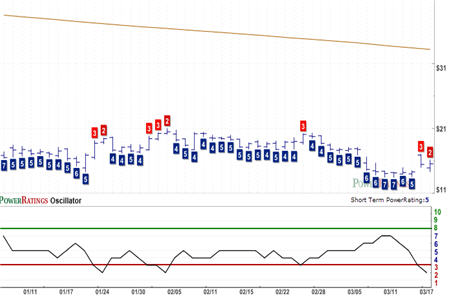
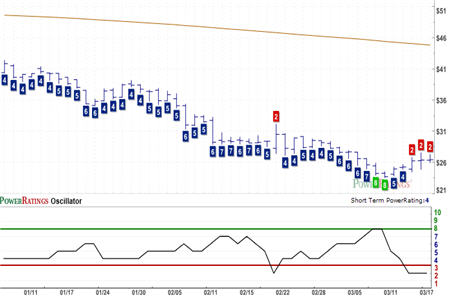
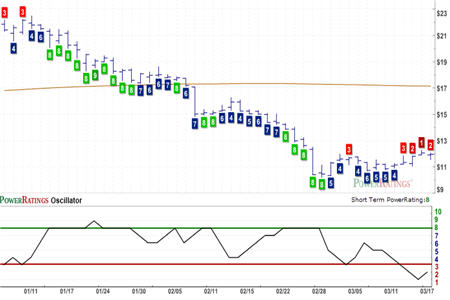
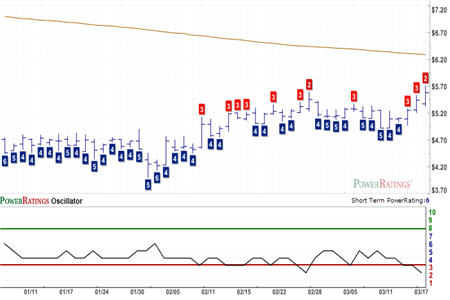
There are five stocks in today’s report that traders interested in looking for strength to sell may want to keep track of over the next few days. All five stocks are up more than 10% in the past five days, and are trading below their 200-day moving averages. I have also listed the 2-period Relative Strength Index (RSI) values for each stock so that traders can have an even better sense of how overbought these stocks are relative to each other.
Note also that all five stocks have Short Term PowerRatings of 2. According to our research, this means all five belong to that class of stocks which are expected to underperform the average stock over the next five days.
Zumiez
(
ZUMZ |
Quote |
Chart |
News |
PowerRating). RSI(2): 94.81
WebMD
(
WBMD |
Quote |
Chart |
News |
PowerRating). RSI(2): 90.22
Iris International
(
IRIS |
Quote |
Chart |
News |
PowerRating). RSI(2): 69.72
Cirrus Logic
(
CRUS |
Quote |
Chart |
News |
PowerRating). RSI(2): 96.20
Avatar Holdings
(
AVTR |
Quote |
Chart |
News |
PowerRating). RSI(2): 95.51

To learn more about these types of stocks, our special, Free Report, “5 Secrets to Short Term Stock Trading” will show you some of the key strategies and attitudes that traders throughout history have used to determine the right time to buy and the right time to sell. Click here to get your free copy of “5 Secrets to Short Term Stock Trading” — or call us today at 888-484-8220.
David Penn is Senior Editor at TradingMarkets.com.