Up, Up and Overbought
Markets don’t have to be in raging bull rallies for a few stocks to get ahead of themselves on their own. Meet four that may be moving too far too fast.
One of the important things to keep in mind about short term stock trading is that while the markets may be moving higher or lower–or nowhere in general–individual stocks have lives of their own. And while these stocks are affected by the larger tide of the broader market, they will have their own “ripples” that traders can focus on and trade successfully.
Looking for overbought stocks right now is an example of studying those “ripples.” The market as a whole has not been seriously overbought since the first few days of April. The sideways movement, which led to more aggressive selling, did help create opportunities for stocks to pull back. But there have been a number of stubborn stocks that have managed to move higher–however tentatively–while the larger tide of stocks was going in the other direction.
And it is when these stubborn stocks are also trading below the 200-day moving average that we become most interested in them. Our research into short term stock price behavior indicates that stocks that move higher aggressively when trading below the 200-day moving average are stocks that are likely to underperform the average stock going forward over the next five days.
There are a lot of ways to characterize the kind of aggressive move higher that these stubborn stocks will do below the 200-day moving average. We use the Relative Strength Index, 10% or greater rallies in a short period of time, and other indicators to let us know when a stock that is rallying below the 200-day moving average may be vulnerable to reversal. But one of the easiest to use indicators requires no “indicator” at all: five or more consecutive up days.
It may sound counter-intuitive. After all, traders are never more bullish than after a stock has rallied for day after day after day. However, our research suggests that when a stock that has been trading below its 200-day moving average starts rallying for multiple days in a row, traders should be thinking about selling (or selling short) rather than buying.
Specifically, we found that stocks that had experienced five or more consecutive up days actually underperformed the average in one week’s time. When these stocks have low, Short Term PowerRatings, they often make for excellent candidates for traders looking to bet against stocks.
Click here to read our research into stocks that have been up for five or more consecutive days in a row
In addition to being up five or more consecutive up days, all four of the stocks in today’s report have 2-period Relative Strength Index values of 98 or more, with one of the stocks having a 2-period RSI of more than 99.
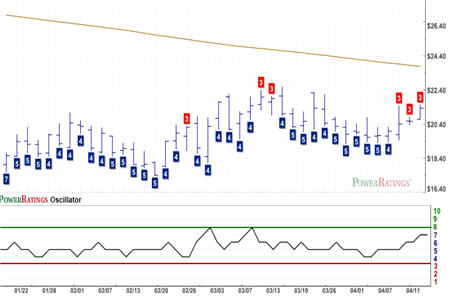
American Woodmark
(
AMWD |
Quote |
Chart |
News |
PowerRating). Short Term PowerRating 3. RSI(2): 98.50
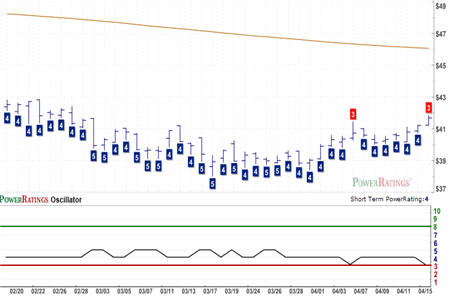
DTE Energy
(
DTE |
Quote |
Chart |
News |
PowerRating). Short Term PowerRating 3. RSI(2): 97.88
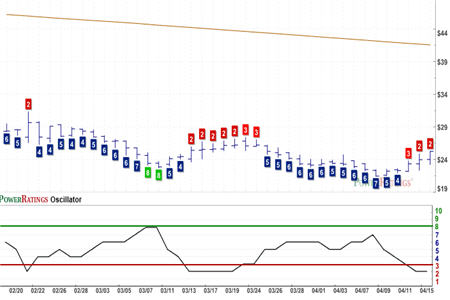
Unisource Energy
(
UNS |
Quote |
Chart |
News |
PowerRating). Short Term PowerRating 3. RSI(2): 99.96

WebMD
(
WBMD |
Quote |
Chart |
News |
PowerRating). Short Term PowerRating 2. RSI(2): 97.86
There are five things that every successful short term stock trader knows about trading markets like these. We have published all five in a new, special report called “5 Secrets to Short Term Stock Trading Success” now available for free. Learn what key factors are involved in turning mediocre speculators into professional-grade, short-term stock traders–and how our Short Term PowerRatings can play a part. Click here for your free report–or call us today at 888-484-8220.
David Penn is Senior Editor at TradingMarkets.com.