US and global markets continue to run
US and global markets continue to run
on the upside. Sentiment, insider sell/buy ratios, and the percentage
of stocks above the 10-day MA are all STARTING to get to overdone levels,
suggesting that sometime soon the market may face a correction. In addition
since 2004 the world index has met with a correction of its uptrend after a
rallies of 16.3% in 2004, of 13% in 2005, and of 17.3% in 2006, and the world
index has now rallied over 15.3% since its June low, suggesting that there may
be some trouble from levels soon overhead. Yet this is a seasonally strong
time-frame and the market may not face much headwinds until the next earnings
seasons opens later in December.
Last week we discussed two sectors we expected to under
perform,
consumer electronics retail and consumer finance. Both sectors continue to
under perform this week, and
(
CC |
Quote |
Chart |
News |
PowerRating) has been particularly weak in a strong market
environment.
This week let’s look at a sector we’ve mentioned before as
being one of our favorite candidates for out performance — capital markets.
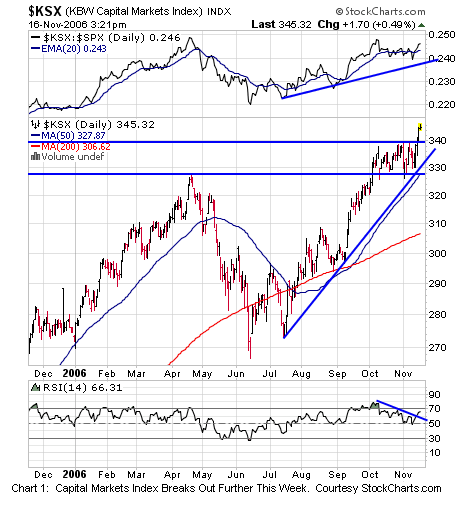
Chart 1 shows the nice technical action exhibited by the
(
KSX |
Quote |
Chart |
News |
PowerRating)
capital markets index, which is matched by the capital markets ETF, symbol
(
KCE |
Quote |
Chart |
News |
PowerRating).
The index raced to new highs in September, consolidated and go support at its
previous highs as well as the uptrend line from the July lows, and has broken
out to new highs again this week. The top portion of Chart 1 shows that capital
markets have been gaining relative strength and outperforming the S&P since the
July lows, making it a group to watch from the long-side. The RSI bottom panel
shows the correction ending at 50 and moving higher in the RSI which is still
below overbought levels indicating some room on the upside in the short-term at
least.
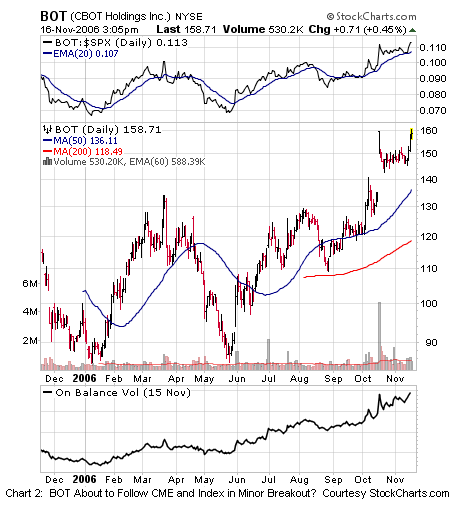
The new high in KCE and capital markets indexes is being
matched by new highs in
(
CME |
Quote |
Chart |
News |
PowerRating) this week. Exchanges have been soaring this past
couple years and CME is breaking out while
(
BOT |
Quote |
Chart |
News |
PowerRating), the CBOT is close to breaking
out of its recent corrective trading range as well this week (see Chart 2).
Notice the new highs in OBV and Relative Strength in BOT that accompany its test
of highs here.
One reason commodity exchanges may be breaking out together
and running amidst euphoria this week in particular is that the last big
commodity exchange NYMEX is going public on Friday (symbol to be NMX). The
beauty of exchanges is that they make money whether the trend is up or down, as
long as volumes increase. With the commodity bull market stalling but still in
what we believe is a long-term uptrend, a breakout by both BOT and CME may be a
signal that the
(
NMX |
Quote |
Chart |
News |
PowerRating) debut will fuel further gains in this group which is
expected to outperform. Those wanting outright longs could buy new highs in both
BOT and CME in one or both and watch the action in NMX carefully Friday. A
successful IPO and decent run-up in NMX could fuel further short-term gains in
the group ahead. KCE could also be used in paired trades against expected
underperformers such as those shown in last week’s column.
We still suggest less than aggressive allocation to global
equities and would look to add or accumulate
(
TLT |
Quote |
Chart |
News |
PowerRating) on corrections as we expect
that the slowdown is not over and that the Fed will not letup on a tightening
bias until the slowdown develops more clearly so that inflation does not
reappear and get entrenched. We like some pairs, and some select big-cap
dominated groups along with the small number of stocks meeting our criteria for
below normal allocation to stocks. We also suggest short-hedging these positions
at least partially with some of the weaker sectors we have suggested over the
last few months.
Lots of bonds and cash as well as light big-cap exposure still
seems prudent to us here until the environment becomes clearer. Long/short pairs
and some broad big-cap exposure to some of our preferred groups can be sparingly
participated in as well. The tradeoff between bonds and stocks should be closely
monitored as bonds are providing a critical cushion to the blow of a slowing
economy in what we suspect is a budding soft-landing that often prove difficult
to trade.
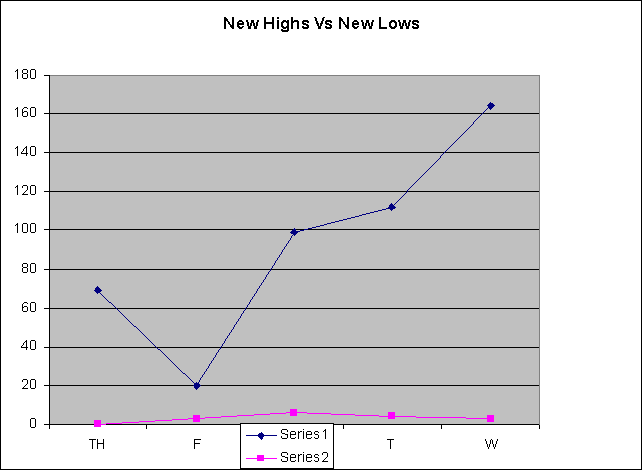
Our US selection methods, our Top RS/EPS New Highs list
published on TradingMarkets.com, had readings of 69, 20, 99, 112 and 164 with 35
breakouts of 4+ week ranges, one valid trades meeting criteria in OTEX , and no
close calls. This week, our bottom RS/EPS New Lows recorded readings of 0, 3, 6,
4 and 3 with no breakdowns of 4+ week ranges, no valid trades and no close
calls. SPI, BWP, MIKR, CHDX remain open trades on the long side from this
methodology.
Mark Boucher has been ranked #1 by Nelson’s World’s Best Money Managers for
his 5-year compounded annual rate of return of 26.6%.
For those not familiar with our long/short strategies, we suggest you review my
book “The Hedge Fund Edge“, my course “The
Science of Trading“, my video seminar, where I discuss many new techniques,
and my latest educational product, the
interactive training module. Basically, we have rigorous criteria for
potential long stocks that we call “up-fuel”, as well as rigorous criteria for
potential short stocks that we call “down-fuel”. His website is
www.midasresourcegroup.com.