USD/CAD Remains In A Corrective Mode
USD/CAD has continued to maintain its corrective/consolidative mode with
upside bias having recovered off its 1.0338 low registered in late July’07.The
correction took the pair to as high as 1.0865 in Aug 16’07 before a new wave of
selling pushed it to a low of 1.0530 on Aug 20’07.
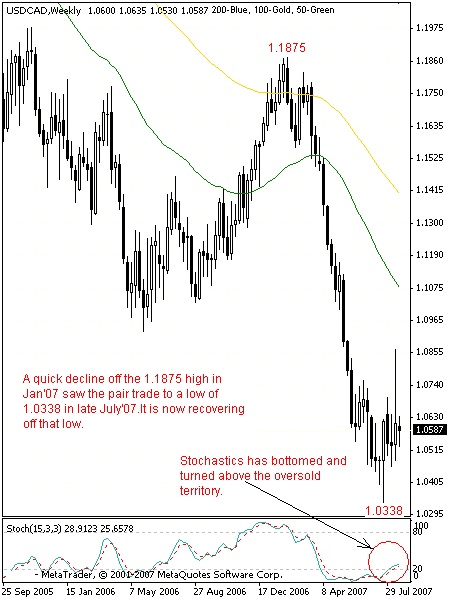
USD/CAD’s fall to the said multi-year low was prompted by its failure at the
1.1875 high set in late Feb’07 which caused a sharp decline for five consecutive
months before finding a temporary bottom at the 1.0338 in July’07.With the
medium and longer term uptrend clearly trending lower, odds are for a resumption
of that downtrend with a retest and possibly a push through the said low.
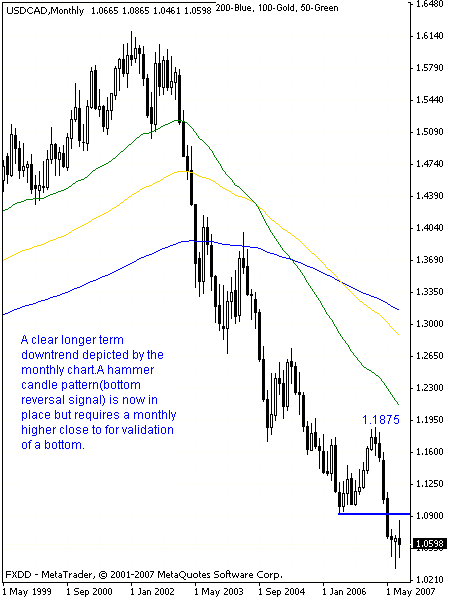
However, technical signals on the daily and monthly (Hammer candle) time frames
continue to suggest that corrective strength could be seen in the nearer to
short terms.
USD/CAD Daily Chart

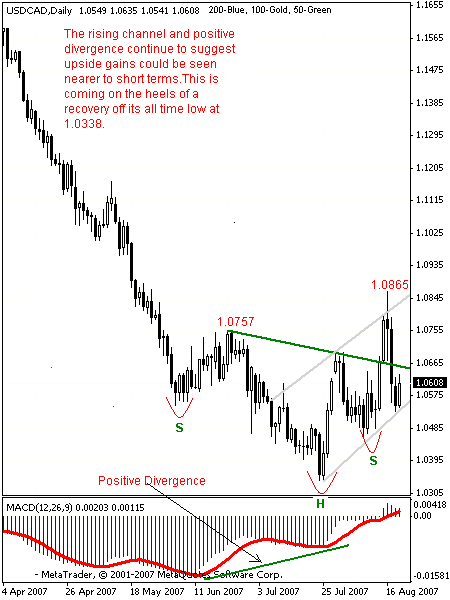
A closer look at the daily chart (figure) displayed above presents those
technical indications. The pair’s decline off the Jun 21’07 high at 1.0756 to
July 25 low at 1.0338 was not confirmed by the MACD leading to what is called
positive divergence, a situation where a momentum indicator does not confirm a
new price low but makes a higher low, thereby indicating the likelihood for a
trend reversal. Secondly, a reverse head and shoulders pattern has formed,
triggered and now turned back below the pattern’s neckline.Lastly, the pair is
now trading in a short term rising channel creating a pattern of higher
highs/higher lows suggesting higher prices while maintaining in the said
channel.
Having observed the above scenario, upside target off its channel base remains
at the 1.0840 level, which represents its channel top/Aug 16’07 high.
Penetrating and negating here will open the door for further upside gains
towards its .382 Ret (1.1875-1.0338) with a turn above this zone putting the
next upside objective at the 1.1103/06,its .60 Ret/May 28’06 low and then the
1.1167 level, its May 10’07 high. Its daily MACD remains supportive of this view
as it has pushed above its zero line. On the other hand, a break below the
channel base currently at 1.0537 will trigger an alternative view and signal
weakness towards the 1.0461 area which marks its Aug 08’07 low ahead of its all
time low at 1.0338. All in all, although USDCAD broader bias remains to the
downside in both the medium and long terms, it is vulnerable to corrective
upside gains in the short term.
USD/CAD Weekly Chart

USD/CAD Monthly Chart

Mohammed Isah is a professional technical market analyst, mentor
and instructor. He initially traded stocks and now primarily focuses on forex.
He was former market analyst at fxinstructor.com and currently he is head of
research and technical strategist at
www.fxtechstrategy.com, a website dedicated to currency research. He can be
contact at: m.isah@fxtechstrategy.com
