Use PowerRatings Charts to Spot Stock Turning Points
Our PowerRatings charts are a valuable tool for short term traders. For one, our PowerRatings charts graphically show how the PowerRatings of both stocks and ETFs advance and decline as buyers and sellers drive markets back and forth between overbought and oversold extremes.
But more than this, there are other ways that stock and ETF traders can use our PowerRatings charts. For example, traders can use the appearance of low Short Term PowerRatings in stocks or ETFs that are trading above the 200-day moving average as a signal that the advance may be fading and profit-taking a wise decision.
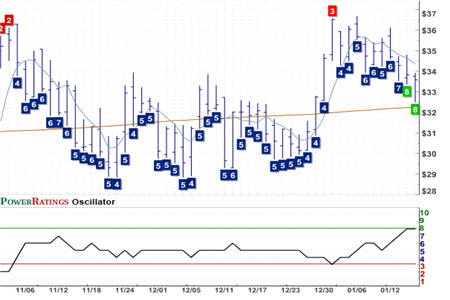
Consider the PowerRatings chart of Stanley Inc.
(
SXE |
Quote |
Chart |
News |
PowerRating).

There are two instances when the appearance of low Short Term PowerRatings in SXE helped alert traders to short term tops. The first comes in earliest November after the stock had climbed from $27 to $36. The second arrived more recently in January, after SXE had rallied from the high 20s to the mid 30s.
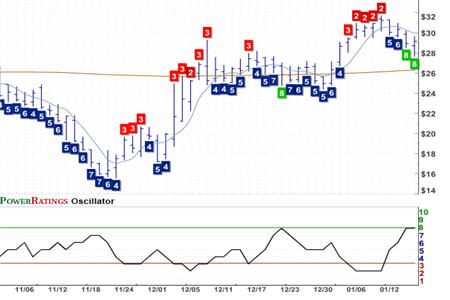
Sometimes these low Short Term PowerRating “warnings” can be persistent, and appear trading session after trading session. That was the case in the PowerRatings chart of Jos A Bank Clothiers
(
JOSB |
Quote |
Chart |
News |
PowerRating), which revealed a string of low Short Term PowerRatings trading days as the stock rallied around the Thanksgiving holiday in 2008 into the first few weeks of trading in December.

Even though these low Short Term PowerRatings did not result in a sharp sell-off in the stock, they did anticipate a period of little progress for JOSB for several days before a Short Term PowerRating upgrade to 8 alerted traders to the opportunity for upside.
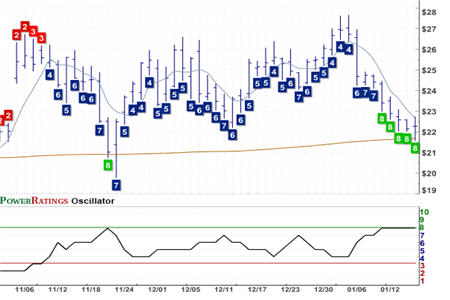
This last chart of Greatbatch Inc.
(
GB |
Quote |
Chart |
News |
PowerRating) shows how both low and high Short Term PowerRatings can help traders anticipate market turns.

We see an instance of the first case involving low Short Term PowerRatings early in November as the stock rallied up from below its 200-day moving average. Then, early in the second half of November, a sharp pullback to the 200-day moving average resulted in a Short Term PowerRating upgrade to 8. Within five days, GB had climbed from about $20 to more than $25.
Does your stock trading need a tune-up? Our highest Short Term PowerRatings stocks have outperformed the average stock by a margin of nearly 17 to 1 after five days.
| Click here to start your free, 7-day trial to our Short Term PowerRatings! |
Whether you have a trading strategy of your own that could use a boost or are looking for a way to tell the stocks that will move higher in the short term from the stocks that are more likely to disappoint, our Short Term PowerRatings are based on more than a decade of quantified, backtested simulated stock trades involving millions of stocks between 1995 and 2007. Click the link above or call us at 888-484-8220, extension 1, and start your free trial today.
David Penn is Editor in Chief at TradingMarkets.com.
