Use the 2B Strategy to Catch Moves
The ‘2B’ reversals are among the most
panic-driven chart patterns and trading setups I have ever experienced in my
early trading years. The most fascinating and the least philanthropic market
mechanics involved.
I already made an attempt to deconstruct and
illustrate the ‘2B’ type of reversals in an article published here last year. In
addition, the ‘2B bottom’ scenario which I advanced here earlier this year
regarding the Japanese Yen versus the US Dollar has not yet been invalidated,
although I must say it has not been strongly reinforced so far either.
Last year, in my view, the Canadian Dollar had
been the most interesting major currency across foreign exchange. Mostly because
of the Canadian Dollar, 2006 could have been as well labelled the year of the
‘2B bottom’.
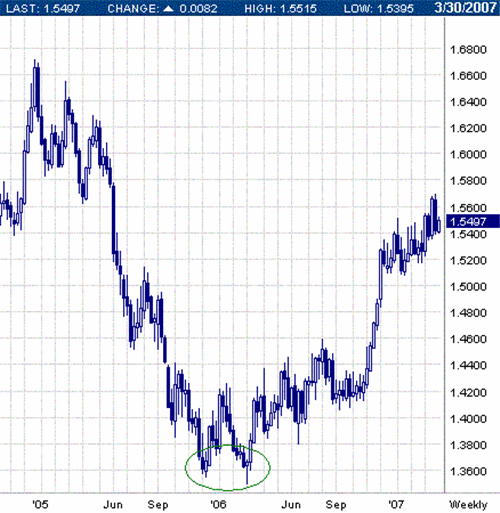
Momentum traders may feel attracted to the
current, short-term bullish developments of the EUR/CAD – still, this pair’s
uptrend, not yet reversed, actually emerged quite a while ago, last year in
early March, and had been preceded by the appearance of a ‘2B bottom’. Since
back then, the EUR/CAD has already been able to appreciate for about 2,000 pips.
copyright FutureSource.com
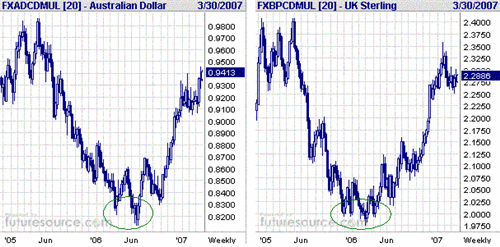
Price action that could have been interpreted as a ‘2B bottom’ became visible in
the AUD/CAD in June last year, since then the pair has managed an almost
1,000-pip appreciation. The GBP/CAD’s own uptrend – so far a multi-month,
multi-thousand-pip appreciation – started off immediately after the appearance
of a ‘2B bottom’ last year in March.
copyright FutureSource.com
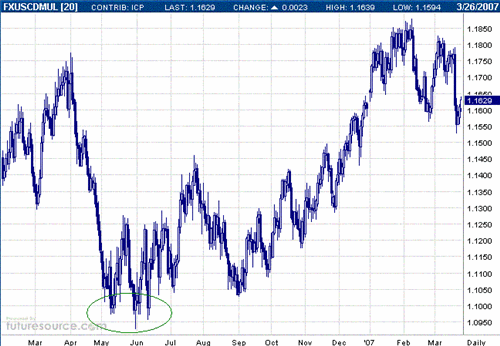
Last year the day of May 31st proved as a remarkable point of price inflection
in the major USD/CAD market – once again, a ‘2B bottom’ was involved, and a
personal decision to go long came with no hesitation. Over the following months
the pair managed to gradually surface out of extreme bearish conditions, having
recently posted levels approximately 1,000 pips higher than the lows seen last
summer.
copyright FutureSource.com
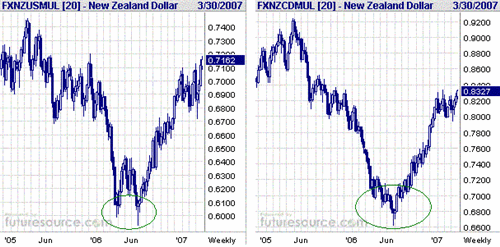
Just a few weeks in the afterwards of May 31st,
2006, in late June the bullish reversal of the NZD/USD took the shape of perhaps
one of the most compelling ‘2B bottoms’ I ever experienced. Meaning, one of the
most intriguing chart patterns I know making its appearance in two different USD-based
markets at approximately the same time of the year – hinting not only at a
possible appreciation of the directly corresponding markets i.e. the USD/CAD and
the NZD/USD, but also at an all the more sizable rebound of the New Zealand
Dollar against the Canadian Dollar.
Since late June last year, the NZD/USD has
managed an almost 1,000-pip recovery. Since July last year, the NZD/CAD has seen
a multi-thousand-pip rebound. Moreover, there is no clear evidence that the
bullish frenzy in these two markets is being compromised nowadays.
copyright FutureSource.com
However, ‘2B bottom’ chart appearances preceded
notable swings or even new trends during 2006 in other currencies as well. Two
such instances come to mind right now.
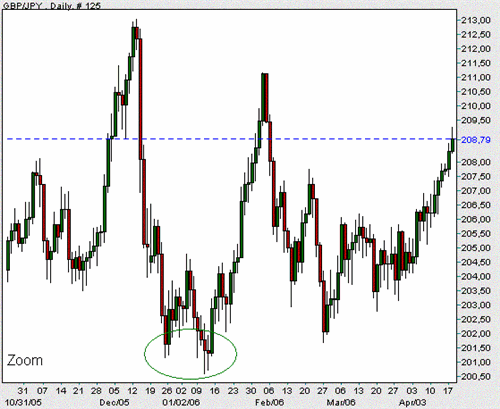
First of them, the day of January 12th, 2006
revealed a ‘2B bottom’ in the GBP/JPY, daily chart wise. In just a couple of
weeks then this Yen cross pair surged for about 1,000 pips before finding an
interim top on February 3rd (the day I shorted the EUR/JPY). January 12th also
printed the last year’s low in the GBP/JPY from where a staggering 3,000-pip
uptrend had already made history.
NetDania.com, data feed FXCM.com
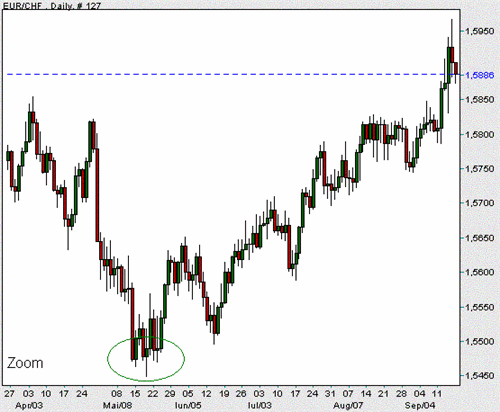
The second ‘2B bottom’ instance surfaced on May
18th, 2006 in the EUR/CHF (same day on which I went long the EUR/GBP on a signal
of comparable confidence). No lower low has since been seen, and the almost
1,000-pip uptrend which started last year on May 18th has at no moment so far
been seriously endangered.
copyright NetDania.com, data feed FXCM.com
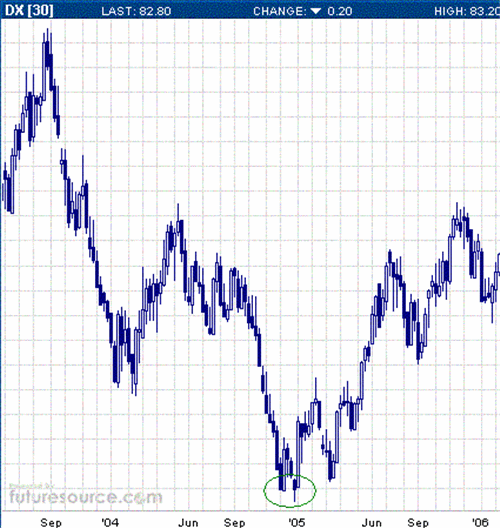
If we go further back into the past – the
remarkable upleg of the US Dollar Index (as well as of the USD/CHF) experienced
over the whole year 2005 had actually been preceded by a ‘2B bottom’ occurence
in those two markets’ weekly chart timeframe.
copyright FutureSource.com
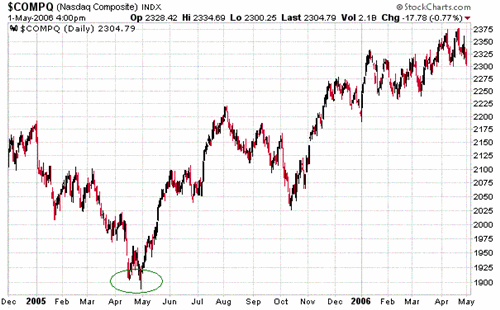
The ‘2B’ reversals are not exclusively linked to
foreign exchange dynamics. I myself have experienced this particular kind of
setups in various, highly liquid futures and stock markets – one example being a
distinct bullish reversal experienced by Nasdaq Composite in the spring of 2005
on behalf of a ‘2B bottom’, daily chart wise.
courtesy of StockCharts.com
Mihai Nichisoiu started to trade currencies first in the local futures
market, then in early 2002 moved to dealing in the wide foreign exchange. Since
the beginning of 2004, Mr. Nichisoiu has become mainly engaged in building a
personal long-term track record in the sense of posting high rates of return
only if at the expense of tight and rigid approaches of risk. Mr. Nichisoiu won
the August 2005 edition of a popular global demo trading contest, after
constantly achieving top rankings during an 11-month long participation. As a
currency speculator, Mr. Nichisoiu is also actively involved in managing and
providing counseling and advisory to a small number of long-term private
connections.
Mihai Nichisoiu can be contacted via his recently established, personal website
www.mihainichisoiu.com.
