Use This As A Guideline For Trading Range Action
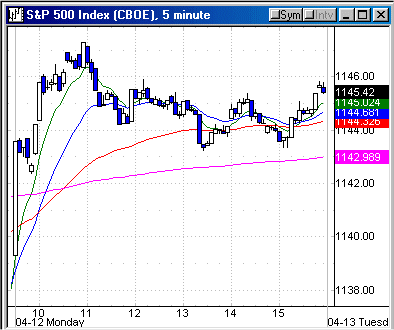
What Monday’s Action Tells You
The SPX has been digesting the recent short term
overbought condition by trading sideways the past 5 days into the lower part of
the 1150 -1161 resistance zone. The highs for the past 5 days have been between
1150.57 and yesterday’s 1147.29 high. The range for the 5 days is just 16
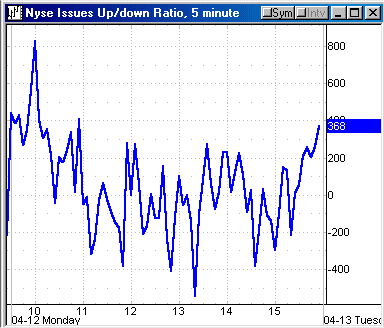
points, less than 1.5%. The 4 MA of the volume ratio has declined from 65 on 4/5
to 41 yesterday while the 4 MA of breadth is now -533 and +48 yesterday. It was
another light NYSE volume day following the long weekend at 1.1 billion with the major indices up all up from 0.5%
-0.7%. The primary sectors were in-line with the indices except energy with the
OIH, +2.3%, coming off a net +1.5% last week.
The primary thread in price and
volume from yesterday’s market action was the decline in utilities as a group as
you can see in the S&P 500 screen, which is also evidenced by the TLTs which
closed yesterday at 85.74 off an 85.60 low. The TLT is down from the 91.48 high
on 3/17. If one were long equities because of the economic recovery how could
that same portfolio manager/trader not have been short bonds into the strength?
The obvious primary thread in price was in the energy sector but it was not
accompanied by significant volume as evidenced by
(
BJS |
Quote |
Chart |
News |
PowerRating) and
(
NBR |
Quote |
Chart |
News |
PowerRating) both
up about 2.8% on just 68% of their average 30-day volume. In fact, in the NDX
100 only two stocks traded at their average volume or more. At the top was
(
CMCSA |
Quote |
Chart |
News |
PowerRating),
+3.5%, on +21% more volume and
(
YHOO |
Quote |
Chart |
News |
PowerRating) at the bottom, -2% on +35% volume.
Â
| Â | Tues. 4/6 |
Wed. 4/7 |
Thur. 4/8 |
Fri. 4/9 |
Mon. 4/12 |
Index |
|||||
| SPX |
|||||
High |
1150.57 | 1148.16 | 1148.97 | H | 1147.29 |
Low |
1143.30 | 1138.41 | 1134.52 | 1139.32 | |
Close |
1148.17 | 1140.50 | 1139.32 | O | 1144.94 |
% |
-0.2 | -0.7 | -0.1 | +0.5 | |
Range |
7.3 | 9.8 | 14.4 | L | 8 |
% Range |
67 | 21 | 33 | 70 | |
INDU |
10571 | 10480 | 10442 | I | 10514 |
% |
+0.1 | -0.9 | -0.36 | +0.7 | |
Nasdaq |
2060 | 2050 | 2053 | D | 2063 |
% |
-0.9 | -0.5 | +0.1 | +0.5 | |
| QQQ |
37.00 | 36.94 | 36.94 | A | 37.17 |
% |
-1.2 | -0.1 | 0 | +0.6 | |
NYSE |
Y | ||||
T. VOL |
1.39 | 1.45 | 1.19 | 1.10 | |
U. VOL |
531 | 485 | 488 | 610 | |
D. VOL |
846 | 942 | 688 | 482 | |
VR |
38 | 34 | 41 | 56 | |
4 MA |
60 | 52 | 44 | 42 | |
5 RSI |
79 | 61 | 58 | 67 | |
ADV |
1200 | 1611 | 1199 | 1669 | |
DEC |
2122 | 1684 | 2042 | 1621 | |
A-D |
-922 | -73 | -843 | +48 | |
4 MA |
+4 | -130 | -533 | ||
SECTORS |
|||||
SMH |
-2.2 | -0.2 | +0.4 | +0.6 | |
| BKX |
+0.3 | -0.6 | -0.4 | +0.6 | |
XBD |
-0.3 | -0.3 | -0.4 | +0.6 | |
RTH |
+0.4 | -1.1 | -1.5 | +0.7 | |
CYC |
-0.4 | -1.0 | -0.4 | +0.7 | |
PPH |
-0.4 | -0.3 | -0.6 | +.08 | |
OIH |
-0.8 | +0.8 | +1.1 | +2.3 | |
| BBH |
-1.1 | -1.2 | +1.2 | -0.3 | |
TLT |
+0.5 | -0.2 | -0.3 | -0.4 | |
| XAU |
+0.6 | +0.4 | -1.2 | +0.1 |
                                            Â
                                                  Â
Table Legend
^next^
For Active Traders
The contra move down into the 9:50 AM time period
for the QQQ after the up-opening was the best initial long setup but only
advanced to 37.23 then drew a line for the remainder of the session, closing at
37.17. The SPY was a
Flip Top setup between 114.77 – 114.58 but the breakout was only to 115.08
then sideways into the 114.82 close. Net net, it was dull trading for daytraders
in the major indices.
For Today
The SPY closed at 114.82, right at the 114.84
20-EMA on the 5-minute chart but above the 20-EMA on all the longer time period
20-EMAs so it remains trend-up. On the daily chart, however, it is range bound
for the past 6 days between 115.41 – 113.74. The 20-day EMA is 113.51 and is
above the 50, 89 and 200-day EMAs, so the trend-up condition is intact. Use the
114.58 midpoint of the 6-day range as an early guideline for trading range
action. The QQQs closed at 37.17 with the retracement levels to the 39 high at
37.09 and 37.93 with primary support in the 36.25 zone.
I will remain on vacation through the end of
April but will keep you posted on what I think are high probability situations.
There is a significant time zone in early May which is important and I will keep
you up on the price action into that zone which is the key to how the time zone
might be a factor in either direction.
Have a good trading day,
Kevin Haggerty


