Use This Candlestick In Your Trading
The market gapped up,
but this momentum did not last long time. S&P 500 E-Mini
(ESH5) formed a 1-2-3 top on its 5-minute chart, and it began to look for a
potential support level.
10:40:17 (From TradersWire)
![]()
| Action | Symbol | Order Type | Setup | Stop | Current Price |
| Buy | ES | Market | Gap- Fill | 1191.75 | 1192.75 |
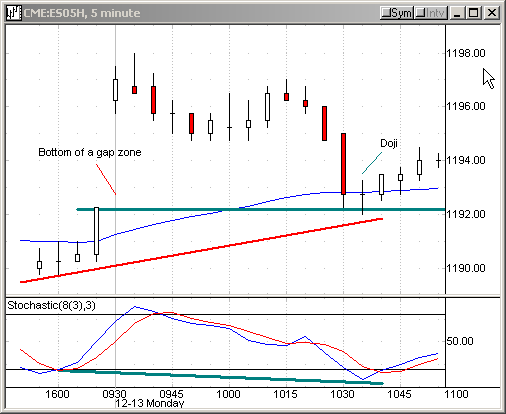
Look at the chart below. Shortly after 10:30, ES
tested the lower boundary of a gap successfully and formed a doji bar at the
60-period EMA. Notice, the stochastic was showing a
reverse divergence. We
bought ES at the market and managed to lock in one-point profit about 10 minutes
later.
10:51:03
Follow up on ES (10:40)
Sell half of the position to capture one point gain. ES is at 1193.75, up 2.00.
Move stop to breakeven. Â Â Â
Have a nice afternoon session.
If you have questions, feel free to mail them to me.
Â