Use this tool to trade Soybean options
In my
previous article, I introduced a tool called Diamonetrics. I explained that
the Diamonetric Grids are used to forecast likely the expiration range targets
with which to tailor make an options strategy to take advantage of.
Placing the D-Grids to where they are accepted
by the chart and yield very few if no fake-outs and only reveal true break-outs
is still closer to art than science so as pupils attempt to develop their
artistic approach, they email me their work for me to critique.
In this article I discuss an email that I
received yesterday and as I begin to write more for TradingMarkets, it would be
cool to share the excitement that my regular pupils enjoy ‘during the fact’ such
as last expiration when
(
GOOG |
Quote |
Chart |
News |
PowerRating) hit its target to the penny. To
witness the success/failure rate closer to real-time, visit
www.riskillustrated.com. While you
are in the Diamonetrics Forum check out “GOOG for SEP and OCT.”
Soybeans
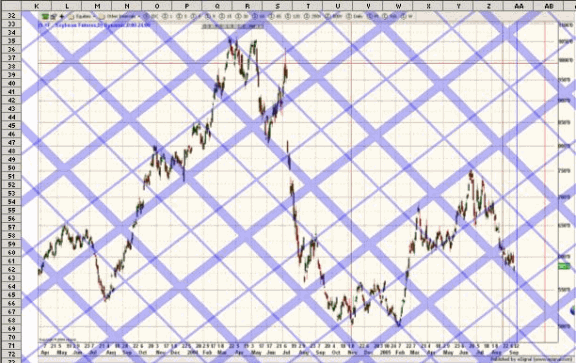
I received the following request “Charles,
could you critique this D-Grid of Soybeans continuous futures chart? Soybeans
seem to respect mid channel lines as well as major channel lines. It appears to
be in a down trend within a mid channel now. Oct 22 ’05 expiration (the red
line) is difficult to analyze and depends on what soybean does in the next
several weeks. It makes an approximate range between 585 and 620 assuming
soybeans stays in the mid channel and doesn’t cross the next ascending mid
channel. If it does, then soybeans would be on the left half of a major or the
next minor descending channel diamond. More technical analysis is necessary to
decide on potential trades. I would appreciate your feed back. Thanks Murph.”
Courtesy of
www.esignal.com
RD: Firstly, when I created the Diamonetric
tools, the objective was to allow the user to exercise complete flexibility to
place the D-Grids however they preferred.
Personally, I recognize and respect the market’s
ability to consistently present to me nearly perfect symmetry. When I cannot
find the symmetry, I move on.
There are two attempts, below, to discover
symmetry in the Soybean chart that you sent to me. Before I comment on why I
rejected my own first attempt there are some comments that I have for your
effort, above.
Observations of your
D-Grid placement
1. Your D-Grids are rotated slightly downward rather than using the 90° and 180°
axes.
2. Your Major Channel D-Grid is no longer bisected at 50% by the Mid-Channel
D-Grid, creating unequal size diamond between the two D-Grids.
This all comes under the category of personal
preference. They cannot be “Wrong†if they make you money. The style that you
develop for yourself will perhaps seem ad hoc to mine and hopefully prove to be
superior in consistently generating profits from the markets. My comments below
will be confined to the attempts below because my expertise is limited to my own
experiences with symmetrical and equal size diamonds.
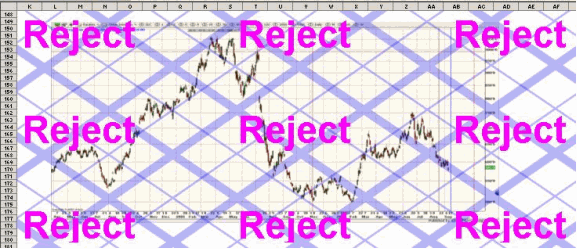
My first attempt is more closely related to your
effort above but I rejected it in favor of my second attempt where more
consistent symmetry exists.
Courtesy of
www.esignal.com
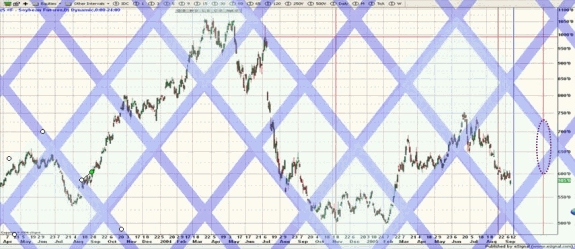
Simply, the accepted D-Grid discovers consistent
widths of the Major Channels. In other words, the down-trends are just as wide
as the up-trends and in this case, the Mid-Trends are not as well accepted as
the Mid Channels so I deleted the Mid Channels. In contrast, the one above has a
down-trend width of one and a half Major Channels and it is looking like the
above Up Channel is trying to widen it self from a Major Channel to one and a
half Major Channels.
Courtesy of
www.esignal.com
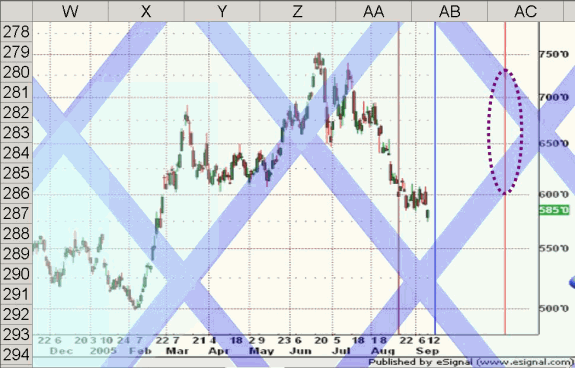
The oval on OCT 21 is my forecast for the NOV
Soybean Options expiration range (600 to 730).
Courtesy of
www.esignal.com
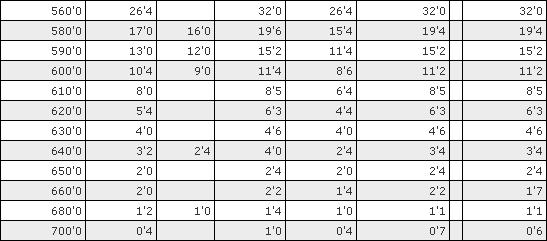
Looking at the options chain (Futures at 579),
how do you want to play it?
Courtesy of
www.cbot.com
Bull Spreads
All the bull spreads are cheap because of the steep call skew.
Butterflies
The butterfly range warranted by the D-Grid suggests something like the
600/660/720 for about 7’1* cents (10’4 — (2*2’0) + ‘5. Seems cheap but remember
that a butterfly is a bull spread against a bear spread and in this case the
bears spread is too cheap to sell to save 1’4 cents.
This is no recommendation but I would buy the
580/600 for 6’4ish and look to at least double my money if not more. If the
current down move violates the D-Grid’s Major up Channel coming into play then I
can consider bailing out for salvage value.
Charles Cottle
Charles Cottle is a veteran professional options trader and the co-founder of
Thinkorswim, Inc. the second largest brokerage firm in America specializing in
options. From 1981 to 1989, Mr. Cottle’s pit trading experience included trading
in the General Motors options pit, the Bond options pit, the T-note options pit
and the Grain Options. His exchange membership included the CBOE, CBOT and CME.
In 1989, as a member of the CME Mr. Cottle was the local market maker in the,
Currency Options Eurodollar Options, Meat Options and S&P 500 options. Starting
in the late 1980s to the Mid 1990s, Mr. Cottle was the Director of Instruction
at the International Trading Institute, Ltd. where he wrote the manuals, trained
instructors, market makers and programmers when exchange-based electronic
trading was in its infancy.
Between 1999 and 2003, Mr. Cottle co-founded Thinkorswim, Inc. a brokerage firm
specializing in options. In addition to his role as co-founder, he served as the
firms “RiskDoctor” and mentored clients and associate brokers on how to properly
apply hedging strategies and manage complex options positions.
Mr. Cottle is also the author of Options: Perception and Deception, primarily at
those training to become professional market makers. He is also the author of
Coulda, Woulda, Shoulda, a book that was designed to teach
institutional-level options strategies to the retail side trader. Mr. Cottle is
the inventor of several hybrid options hedges including the SlingshotHedge. He
also invented and patented Dynamic Adjustable Risk Transactions (DARTs).
In in addition to trading, Mr. Cottle teaches options strategies through
webinars and forums at his websites
RiskDoctor.com and RiskIllustrated.com.
