Using Dynamic Pivot Points to Time E-mini Moves
There are many ways to measure price action in financial markets. Basic floor
trader pivots are one long-time chart tool. Floor trader pivots are static
levels for any given day, the levels do not change. They are useful points of
reference for determining different things about price action. Another similar
tool most traders aren’t familiar with are dynamic pivots.
Standard floor-trader pivot levels are derived from the prior day’s
high/low/close divided by three and then factored to arrive at several measures
of “relative value” of current session’s price movement. Dynamic pivots are
values that change with flowing price action in a given period of time. One of
many versions would be measuring the current price period’s range from low to
high, and then price points of 25%, 50% and 75% levels of current low to high
range.
These values are based on the high and low measure of any given period on a
chart. For intraday or short-term trading, using the cash session (pit) only
chart or all-session (24 hour) chart will give different grid levels in eminis
most days. The same is true for any market that trades electronic and pit
session periods. It’s not a question of which time period settings “work best”
for price measurement tools like this… they are designed to be used within the
timeframe you already trade. Whether your charts are set for cash-session only
in or the entire 24-hour period reference is likewise the same preference for
dynamic pivot settings. They compliment your existing approach, whatever it may
be.

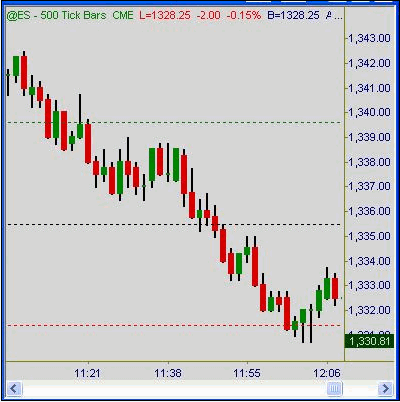
For example, this 500 tick chart of the S&P 500 emini futures (ES) shows
price action moving thru the pivotal grid of 25% – 50% – 75% of measure-period
range levels. In this case it’s the all-session view. Price action below the 25%
level is usually sustained during bearish trend moves. Price action Above the
75% level is usually sustained during bullish trend moves. Price action tends to
pause or turn at the various grid levels in between.

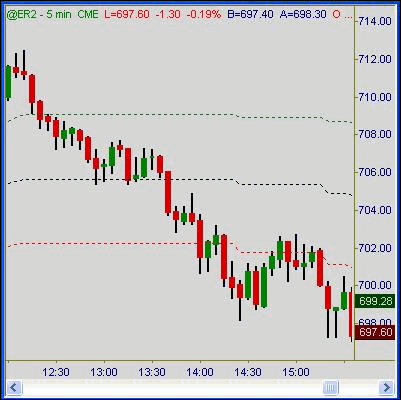
A similar view is shown on a 5min chart of the Russell 2000 (ER2) chart.
Doesn’t matter which timeframe setting is used, price action clearly adheres to
the dynamic price levels as it moves up or down thru a given range.
There are many ways to use this tool as part of your trading approach.
Directional bias filters would be one of those. Price action moving up or down
thru the scale demonstrates continued direction or possible trend reversal
depending on where it stops and starts. Using the levels as secondary price
points to add contracts for bigger trade size is another. Aggressive trailed
stops or outright exits at certain levels when open trades appear to be stalling
out is another good use.
Summation
I personally use TradeStation and NinjaTrader chart services for my own emini
trading. Users of either chart service can download dynamic pivot workspaces
here for convenience sake.
Other chart services may offer this tool as a standard default, or have it
easily written from the equation of current high-low and 25%, 50%, 75% of the
range. Simple as that.
Whatever actual reason(s) dynamic pivot levels affect current and future
price action in a given market is irrelevant. The visible fact exists that price
action across all financial markets do adhere to specific, repeated patterns
when it comes to measured retracements of all manner. Regardless of all else,
price action reacts to these evolving price levels thru any given period of
time. Knowing that fact and using the tool for predictive or reactive purposes
can help add to anyone’s overall success.
Austin Passamonte is a full-time
professional trader who specializes in E-mini stock index futures and commodity
markets. Mr. Passamonte’s trading approach uses proprietary chart patterns found
on an intraday basis. Austin trades privately in the Finger Lakes region of New
York. Click here to visit CoiledMarkets.
