Using Fibonacci To Identify The Most Timely Entries And Exits
When most
market analysts talk about
“timing” the market, they are talking about timely
entries or exits based on their price analysis. I feel there is a better way to
bring the element of time in your analysis. Using the same Fibonacci ratios that
we use on the “price axis” of the market, you can apply these ratios
to the time axis in order to project “dates” or “times” when
the market is more likely to reverse it’s
current trend. This coordinated with the FibonacciÂ
price work you are probably more familiar with, enables you to see a
potential market roadmap that very few others have access to.
So how do we
measure time and project potential change in trend dates?
This is done by measuring the distance
in time between key highs and lows and then projecting
forward in time by the appropriate ratios. We will measure time
from prior highs to highs, lows to lows, lows to highs and highs to lows. We
will measure and compare the time of price
swings in the same direction. We will also look at a prior high to high or low
to low cycle and then project from the intervening low or high, whichever the
case may be.
In the same way that we look for a
“clustering” of price relationships to identify a relatively important
area of price support or resistance, we look for a clustering (three
or more cycles coming together within a relatively short time period) of “time
cycles” to identify time periods where changes in trend are more
likely to be seen. If a market is rallying into a key “time
window”, we would look for a potential high and downside reversal. If a
market is trending down into one of these same “time windows”, we
would then look for a potential low and upside reversal.
Let’s go through an example in the
Nasdaq Composite to help illustrate how this is done.Â
In the middle of August 2000, we were
experiencing a rather healthy rally in the Nasdaq. What I wanted to know at that
time, was when this rally might terminate.
This is rather important information for a trader to know in advance!
The first thing I did was identify the
key highs and lows that I would make my “time
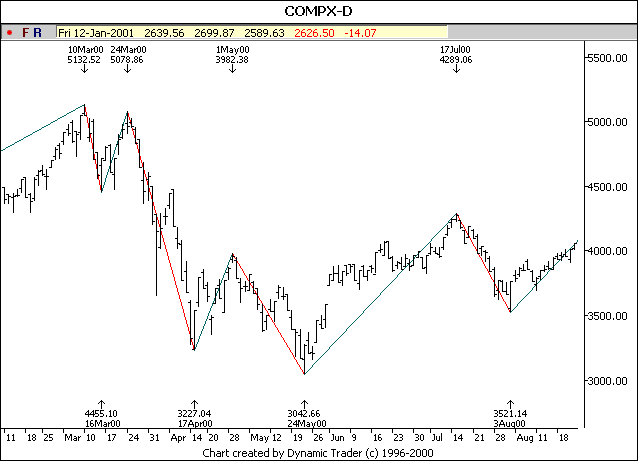
projections” from. These highs and lows are illustrated by
the date markers and by the “swing chart”
overlapping price in the chart below.

Then I started by using
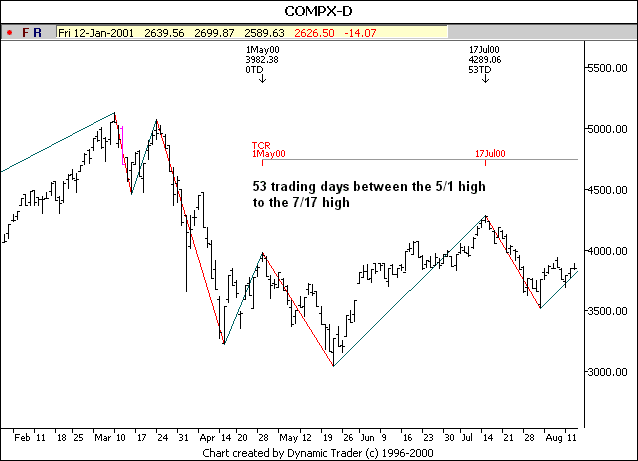
“time lines” on the chart. For example, one of the time cycles I was
projecting was the prior high to high. This was the May 1, 2000 high
to the July 17, 2000 high. This cycle
lasted 53 trading days.

Now that I knew how much
time had elapsed between this high to high, I could project forward in time
using the Fibonacci ratios. I use the
same Fibonacci ratios for timing that I use in my price analysis. (.382,
.50, .618, .786, 1.0, 1.272 & 1.618 are used most often) In this
particular example, I multiplied the 53 day cycle by
.618.

This gave me the result
of 32.7 which was rounded to 33
days. Then we (or the program) counted forward from the end of the
cycle (July 17, 2000) counting the first day as zero. This 33 day count took us
to August 31, 2000, which was the .618 time cycle projection of the prior high
to high.Â

This was only one of
the cycles we used to project August 28, 2000 –
September 1, 2000 as a time period for a potential high and reversal
in the Nasdaq Composite index last year. The additional cycles are listed and
illustrated below. Note that we were looking at a coincidence of at least six
Fibonacci time cycles at that time!
Illustrated from top to
bottom on the chart below:
1.272
time cycle of the 3/10/00 high to the 5/24/00 low (8/28)
1.618 time cycle of the 3/24/00 high to the 5/24/00 low (8/30)
.618 time cycle of the 5/1/00 high to the 7/17/00 high (8/31)
1.618 time cycle of the 7/17/00 high to the 8/3/00 low (9/1)
1.272 time cycle of the 5/1/00 high to the 7/17/00 high projected from the
intervening low made on 5/24/00Â (8/29)
.382 time cycle of the 5/24/00 low to the 8/3/00 low (8/30)

The actual high in this
case was made on 9/1 which was directly within this time window for a potential
high and downside reversal. Would this information have been helpful to
you as a trader? I think so. As a matter of fact, my career is built on this. :)
Hopefully the explanation
above will help you understand and take advantage of the “time
windows” that I will sometimes discuss in my daily commentaries.
Â
How
I Use Fibonacci Levels To Identify Key Support And Resistance Levels
