Using Moving Averages to Gain a Trading Edge
Options traders are always looking for tools to help them predict how the market will move, and one way to do just that is to watch the moving averages.
You’ve probably heard traders talk about a stock’s moving average, and studying a particular stock’s or market index’s moving average can indeed help you gauge whether it’s time to go long, go short, or just stay away.
But just what is a moving average, and why is it such a good tool to help you gauge an equity or index move?
First off, a moving average is simply the average closing price for a stock or stock market index over any given time period. Common time frames used are the relatively long-term 200-day, and the short-term 50-day, 20-day or even five-day moving averages.
Click here to learn how to utilize Bollinger Bands with a quantified, structured approach to increase your trading edges and secure greater gains with Trading with Bollinger Bands® – A Quantified Guide.
For instance, a 50-day moving average is calculated by adding the closing prices for the last 50 trading days and dividing the total by 50. After the next trading day ends, the oldest day’s closing price is dropped and replaced with the newer figure. The point to this exercise is that the moving average smooths out day-to-day swings in prices and creates a recent context in which to judge a stock or equity index’s price trends.
Over time, the average moves as new data is added and old data drops out of the calculation. This is known as a “simple moving average,” as each day in the trading period carries equal weight.
There are other, more complex types of moving averages (exponential, triangular, variable and weighted are some of the more popular ones), but simple moving averages (also known as an arithmetic moving averages), are all that most options investors need to watch.
Reading Between the Lines
Here’s a chart of the S&P 500 index that shows the 200-day moving average (red line) and the 50-day moving average (blue line).
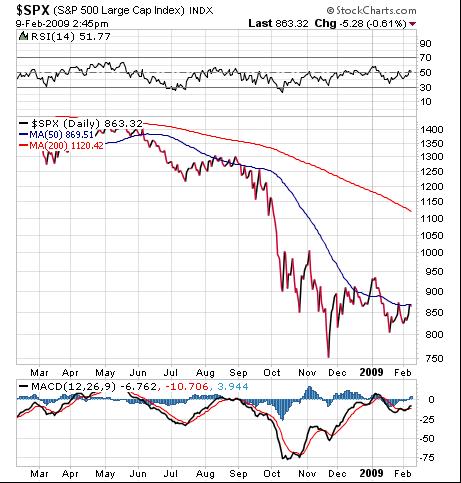
As you can see, the moving averages smoothed out the daily price fluctuations in the S&P 500. This smoothing out, along with the plotting of the actual prices, helps traders identify trends in the market.
The chart here clearly shows that on Feb. 9, 2009, the S&P 500 was trading right at its 50-day moving average (blue line). It also shows that the index is trading well below its longer-term, 200-day moving average (red line).
Because moving averages serve to even out price fluctuations, they make it much easier for chart-savvy options traders to spot short- and long-term trends. The old adage, “the trend is your friend” is most certainly true, and plotting moving averages and comparing them to the current trading price of a given equity or index is a great way to know if the trend in that equity or index is a friend — or a foe.
Making Moving Averages Work for You
The element of time is always critical when trading options, and looking at time frames when considering the usefulness of moving averages also is critical. Short-term traders use five-day, 10-day and 20-day moving averages to see if a stock or index is breaking above or falling below a key moving average level.
Traders who hold options positions for a few weeks or even a few months look at the 50-day moving average as their guide. Long-term option holders are more apt to consult the 200-day moving average for an indication on whether to buy, sell or hold their positions.
But because the moving average data — like most market data — is subject to different interpretations, one trader could look at an average and see one trend on the way, while another could look at the same moving average and anticipate an entirely different trend. Remember, moving averages don’t predict what is going to happen next. Rather, they help you to see where a given stock or equity index has already been.
If you think the current trend is signaling a higher future move, then you will likely be looking to go long with some kind of call strategy. If, on the other hand, you think the current trend is signaling a pullback in the shares, then you might consider going short with put options.
Many options traders only consider buying call options when a stock or index is trading above their preferred moving average. Conversely, many options traders only consider buying put options when a stock or index is trading below their preferred moving average.
For some option traders, moving averages can serve as sell signals. If a stock or index closes the day below its moving average, this could be a signal that it’s time to bail on the calls because the stock is likely to start a downtrend. On the flip side, if a stock closes above its moving average, it could be time to consider closing put option positions, because it indicates the stock may rise.
Whatever strategies you employ in your trading arsenal, always remember to use moving averages, as they are a great tool to help you understand where a stock or index has been over a given period of time and where they may be headed in the future.
Bryan Perry is the editor of Tactical Trader, an options trading advisory newsletter, and is a contributor to the Options Zone Web site.