Using Non-Leveraged ETFs to Track Your Leveraged ETF Trades
With so many new leveraged and inverse exchange traded funds jumping into the market scene, it’s easy for traders to become confused. And confusion – especially when trading some of the more volatile leveraged and inverse ETFs can cause losses.
Here’s one aspect of trading leveraged and inverse ETFs that hasn’t grabbed much of the spotlight – but it’s definitely worth consideration: Remember to compare “apples to apples,” not “apples to oranges.”
Pair Up ETFs With Identical Indices
In the ETF world, my “apples to apples” strategy translates into a simple, but important, technique: When you trade leveraged, inverse, and leveraged inverse ETFs, confirm which index your target fund tracks. Then find a standard fund (not leveraged or inverse) with a closely correlated index to act as your trading guide.
For example: Say the financial sector is falling like a boulder off a cliff, breaking through support. You’re watching the event take place by focusing on a standard fund, in this case, the ^XLF^.
You think: This is a good time to buy the ^SEF^.
But wait … before you click on the “buy” button, consider this …
The Select Sector SPDR Financial ETF seeks to follow the returns of the Financial Select Sector Index. That financial index currently has 82 components, of which the top three, ^JPM^, ^WFC^, and ^BAC^ represent about 32% of the index.
In comparison, the ProShares Short Financials tracks the Dow Jones U.S. Financials Index. The top holdings are JP Morgan & Chase, Wells Fargo and ^GS^, which total about 21% of the index. That index currently lists 267 holdings-obviously many more than the XLF – and cuts a broader swath through the financial sector. (Of course, the SEF moves in the inverse direction of the daily performance of the above mentioned index.)
If you compare the price action of the Select Sector SPDR Financial ETF to the ^IYF^, you would find them to be similar – but not exact – in percentage moves. That’s because each ETF tracks a separate index that contain different holdings. During the financial meltdown experienced during the past two years, at times the IYF outperformed the XLF on a percentage basis. The IYF held more regional banks that steered clear of sub-prime loans.
It stands to reason, then, that using the Select Sector SPDR as your guide to trade the ProShares Short Financials is not comparing “apples to apples.”
What’s the solution? Check out the iShares Dow Jones U.S. Financial Sector Index Fund. You can quickly tell by its title that this fund is closer in identity to the ProShares Short Financials. A quick glance at the holdings show the top three holdings are the same: JPM, WFC, GS, with nearly the same percentage of holdings. As well, there are 264 securities in the IYF, nearly identical to the SEFs underlying index.
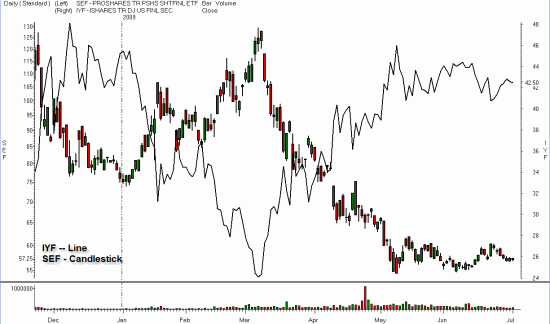
In Figure 1, below, the daily chart shows two price patterns. The line chart represents the iShares Dow Jones U.S. Financial Sector Index Fund (IYF). The candlestick chart shows the ProShares Short Financials. (The volume correlates to the SEF. Left axis: SEF price. Right axis: IYF price.)
Figure 1 – Daily Chart – iShares Dow Jones U.F. Financial Sector Fund (IYF) (Line) & ProShares Short Financials (SEF) (Candlestick)

RealTick® graphics used with permission of Townsend Analytics, Ltd. ® 1986-2009 Townsend Analytics, Ltd.
You can see how the ProShares Short Financials (candlestick) moves inversely to the iShares Dow Jones U.S. Financial Sector Index Fund. The SEF is not leveraged; it moves about 1% higher for every 1% lower the IYF moves. That means it stays more closely correlated to the IYF than leveraged (2x and 3x) funds, which can be more volatile, and involve a higher percentage of tracking errors.
Bottom line: if you want to use a standard ETF to guide you through trades in leveraged, inverse, and leveraged inverse ETFs, check out the index of both ETFs to see if they are closely correlated. If they are, the standard ETF will serve as a more accurate guide throughout your trade.
Toni Turner is a trader and investor with eighteen years of experience in the financial markets. She is the best-selling author of A Beginner’s Guide to Day Trading Online 2nd Edition, A Beginner’s Guide to Short Term Trading and Short-Term Trading in the New Stock Market. Toni has appeared on NBC, MSNBC, CNN, and CNBC. She has been interviewed on dozens of radio programs and featured in periodicals such as Fortune magazine, Stocks and Commodities, SFO, MarketWatch, Fidelity Active Trader, and Bloomberg Personal Finance.
