Using Option Greeks: Implied Volatility and Investor Fear
In my opinion implied volatility (IV) is the most useful of the option Greeks. Implied volatility can be used to adjust your risk control, trigger trades and in a future video I will show you how you can actually trade options on the market’s own implied volatility level.
Implied volatility is relatively simple to understand but is hard to predict. It changes as investor sentiment changes and can be very sensitive to the overall market environment. In this series we will be talking about IV and how it can be used to forecast market direction and make trading decisions.
Implied volatility is a measure of what investors think about future volatility. This means that it reflects what traders “think” about the potential for the underlying stock or index. That information is extremely useful when you can see and analyze those changes over time.
Implied volatility will rise when traders are concerned about risk or are becoming very fearful. Conversely, implied volatility will fall when investors are very confident or bullish. This matters to option traders because an increase in implied volatility causes a rise in option premiums. That is bad for option buyers but can be good for sellers. When implied volatility is falling and traders are becoming more bullish, option prices fall and being a call buyer may be a better alternative than being a put seller.
One of the most useful forms of implied volatility is the implied volatility index of the S&P 500 index options (SPX) usually known as the VIX. In a very real way the VIX reflects the fear of the general population of investors. This can be useful as a way to understand the strength of a given trend and as a way to forecast reversals in the market.
The VIX will show the relative risk or fear in the market compared to recent history. Traders will try to identify those points in the VIX when investor sentiment or fear has reached extremes.
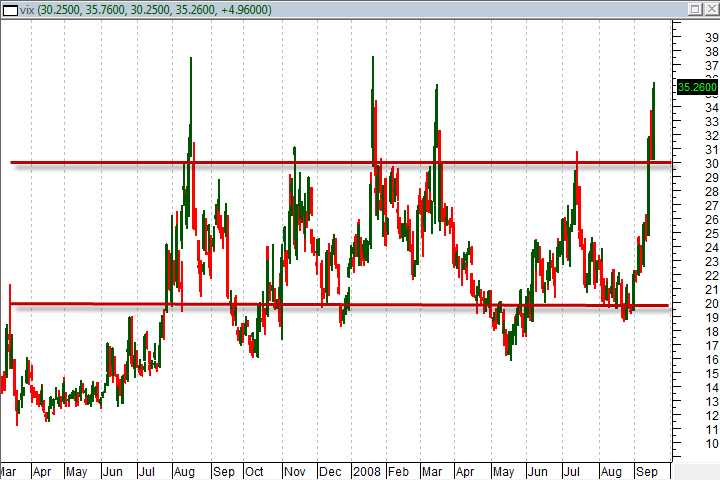
As you can see, in the chart below, one of the things we look for when evaluating whether the VIX or investor sentiment is at extremes is whether or not the index is at the top or bottom of its channel. When the index is at resistance (the top of the channel,) we know that fear is at an extreme and we should be controlling any market exposure to the downside of the market very conservatively. It does not mean that we should automatically become bullish but, it does mean that we will act as prudently as possible to control the risk in any short positions or long puts.
Conversely, the market and traders in general can become over confident. Quite often a bounce off the lower side of the channel can indicate a significant shift in investor sentiment from low risk and growth to high risk and volatility. The channels on the VIX will shift over time but typically stay within a given range, such as the one shown on the chart, for several quarters to a few years.
Daily chart of the VIX or “CBOE Volatility Index”

John Jagerson is the author of many investing books and is a co-founder of LearningMarkets.com and ProfitingWithForex.com. His articles are regularly featured on online investing publications across the web.
