Using Options to Trade Mean Reversion
Many of the strategies traders use fall into one of the following categories:
Momentum: momentum and trend-following trades are familiar to everyone, whether you bought tulips in the Netherlands in 1636, tech stocks in the 1990s, or shorted the investment banks in 2008. The challenge with any momentum play is, of course, knowing when to get out.
Click here to learn how to utilize Bollinger Bands with a quantified, structured approach to increase your trading edges and secure greater gains with Trading with Bollinger Bands® – A Quantified Guide.
Mean reversion: a mean reversion trade expresses the thesis that an asset has deviated too far from its real value – or at least from its mean price – and profits when reversion to that mean occurs. Indicators which express short term technical “overbought/oversold” readings are one example of this approach, but so is long term value investing.
Arbitrage: arbitrage trades typically profit from a price differential between two similar or identical assets, usually resulting from a temporary market inefficiency.
In this article, we’ll suggest one way of finding profitable mean reversion opportunities, and discuss how to use option spreads to trade those opportunities.
- A Tendency, not Just a Trade
The most important thing to realize about any strategy that relies on mean reversion is that you are looking for a relative edge, not absolute success on each trade. In other words, sometimes an asset won’t revert to its mean, at least not in your timeframe, and you’ll have to take a loss. We’ll use options to reduce the sting from some of those losses, but the key here is that no one trade should be viewed as particularly significant: the tendency of asset prices to revert to some mean is a consistent feature of any relatively liquid and efficient market, and the way to profit from that tendency is by consistently making the relevant trades within the context of rational risk management.
Let’s address the risk question up front: the bad news is that when an asset doesn’t revert to whatever means you’ve targeted, it will probably continue breaking in the opposite direction. In other words, if a mean reversion trade goes bad, it can go very, very bad, so some pre-defined risk level is absolutely necessary. If you’re trading stocks or futures, it’s essential to set stops. If you’re buying options, you should be comfortable losing the premium paid, and if you’re selling options, you should use risk-defined spreads and, again, be comfortable incurring the maximum possible loss on the spread. Those prescriptions may sound overly pessimistic, but in reality there’s no better feeling than knowing that you’ve sized your trades in such a way that, even if the worst case comes true, you can tolerate the result.
- Identifying Mean Reversion Opportunities
Finding good mean reversion opportunities is straightforward: you simply need to define a range across some time span, and take contrarian positions when the underlying moves beyond that range. Here are some rules for a very basic (but effective) mean reversion strategy:
- Note the intraday high and low of the prior week. We use intraday prices rather than closing prices to get a more accurate picture of the prior week’s trading range.
- If the underlying closes above (below) the prior week’s range, sell (buy) the underlying at the close.
- Exit the trade 7 days later or when a new signal is generated, whichever comes first.
Now, this is obviously just one strategy among many you could use. We’re using a weekly range as our basis, but other timeframes are worth exploring as well, including even intraday ranges. Nor should you restrict your research to price levels alone – viable strategies can be developed using moving averages and Bollinger Bands, for example. Our exit criterion is also somewhat arbitrary; performance is robust across shorter and longer holding periods. Notice that we allow for new signals to reverse our exposure; however, the average holding time per trade was still 6.8 days, indicating that most trades were exited based on our time condition, rather than due to an offsetting signal. As for the question of which underlyings to use, we prefer to use indexes or ETFs that track a particular industry, index, or country in order to avoid the surprises that often come when dealing with individual stocks or commodities.
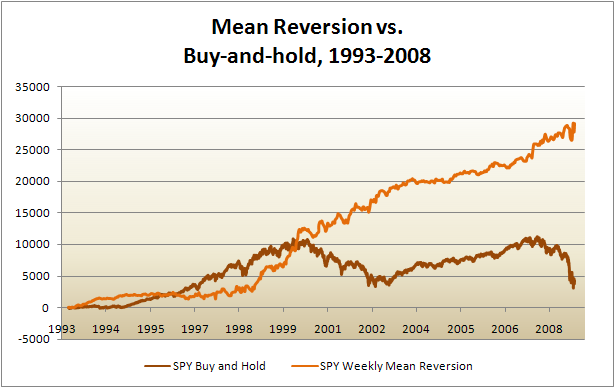
Trading this very simple strategy on the S&P 500 ETF (the Spyders) easily beat a buy-and-hold approach. The attached chart simulates a buy-and-hold portfolio that sat in 100 shares of SPY since inception, versus a portfolio that goes long or short 100 shares of SPY per the signals described above. We did not factor in any transaction costs or interest on cash.
As we mentioned, this is not a strategy for traders who can’t bear to lose: trades were profitable only about 53% of the time, though the winners were about 25% larger than the losers. We tested a variation of this strategy recently focusing on mean-reversion tendencies in the week after options expiration (“Mean Reversion After Expiration”), and found similar results.
- Two Option Strategies for Trading Mean Reversion
The reason we would want to trade options on the basis of these mean reversion signals is twofold. First, we can achieve the same level of risk exposure with long puts, long calls, or vertical credit spreads as we had by trading stock but with a smaller cash outlay and/or lower margin requirement. We can put the difference in a risk-free interest-bearing asset. That may sound like a trivial concern given that each trade only lasts 7 days, but keep in mind that this weekly mean reversion strategy is still in the market about 78% of the time, so it matters where you stash your cash.
Secondly, and more importantly, we want to use options to improve the performance of the strategy. Because options have exposure to changes in volatility and to the passage of time, they offer profit opportunities above and beyond the mere directional changes in the underlying. Here are two ways we might use options to trade mean reversion signals:

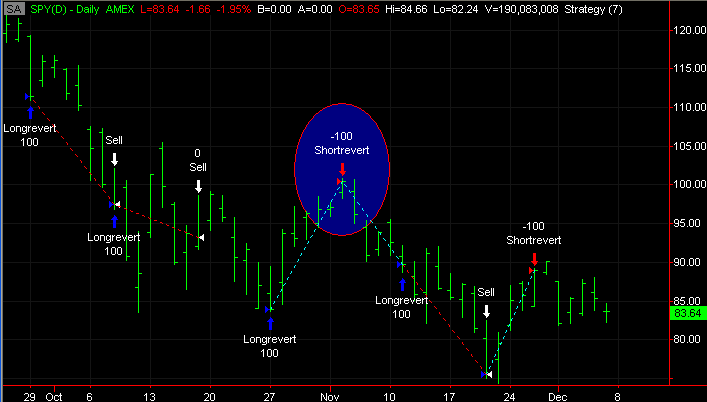
A) Sell out-of-the-money (OTM) vertical spreads. This approach consists of selling one OTM option, and buying an even further OTM option to define risk and hedge the trade. Let’s use a concrete example: on November 4, 2008, this mean reversion strategy generated a sell signal with SPY at 100.41. We could have sold the following spread:
short 1 SPY Nov 110 call for INITIAL_CONTENT.48;
long 1 SPY Nov 112 call for INITIAL_CONTENT.27;
for a net credit of INITIAL_CONTENT.21.
Now, barring a dramatic move lower in the underlying, this trade wouldn’t profit very much over just 7 days, so we would plan on leaving these credit spreads open for longer periods of time to allow time decay to improve profitability. Notice that we chose strikes at 110 and 112, leaving a ten point buffer zone between the underlying and the short strike of our trade. That way, even if the underlying moves against us, we will still be profitable as long as SPY is lower than 110.21 at expiration. In this case, SPY moved lower immediately, and closed at November expiration at 79.52, allowing us to keep the full credit received on the trade.
You may have noticed that a long signal was generated on November 11, with SPY at 89.77. Had we followed the same approach in that instance, we could have sold a put vertical with a short strike at 80 and a long strike at 78 for a net credit of about INITIAL_CONTENT.23. At November expiration, SPY closed just a hair under the breakeven point on that trade, making it a small loss; but the two options spreads together were solidly profitable over this period, versus a loss of 3.68 SPY points for the directional stock strategy.
B) Buy at-the-money (ATM) puts. The credit spread approach is excellent for profiting from time decay, but it is a little sluggish and isn’t as responsive as outright put ownership for traders who want to profit from increases in implied volatility. If an underlying moves high enough to generate a sell signal for this strategy, chances are that implied volatility may have declined over the very short term enough to make put options cheap on a relative basis. If the trade is successful and the underlying moves back down into its prior range (or lower) right away, put owners would stand to profit both from directional exposure and from an increase in implied volatility.
For comparison purposes, let’s say we received the sell signal generated on SPY on November 4, 2008 as discussed above. With SPY at 100.41 and the implied volatility in ATM Nov SPY options at 48%, we could have bought the following ATM put: long 1 SPY Nov 100 put for $3.73.
Five trading days later, a long signal was generated, but this put had already risen to $10.67. (Technically, that’s a 186% return on capital risked, but don’t get too excited – it’s just as easy to lose the full premium paid for the contract, which is why a sound risk management approach will entail sizing your trades according to the amount of capital at risk.) Notice that over this same period, implied volatility in these options rose to around 60%.
The same thesis doesn’t lend itself to buying calls. Since implied volatility tends to correlate negatively with price movement, buying calls in anticipation of mean reversion to the upside will often entail overpaying for those options and realizing smaller gains – even on a very directionally successful trade – due to declining volatility premium.
- Conclusion
The mean reversion strategy tested above is just one example of broader market tendency. Our aim has been to show that a) a mean reversion strategy can outperform a buy-and-hold approach over the course of a market cycle, and b) that traders can use options to improve the performance and reduce the risk of such strategies.
Jared Woodard is the principal of Condor Options, a New York-based research and trading firm focusing on market neutral trading strategies. Condor Options publishes educational newsletters teaching iron condors, calendar spreads, and volatility-based options trading with a focus on risk management and quantitative analysis.

