Video Course, Part 3
Video
Review
Part
3: QQQ Trading Strategies
What
charts do we use to trade the Qs?
Sound like a silly
question? Well, not really. While QQQ charts are fine for monitoring longer timeframes, they can
actually be potentially misleading and detrimental when trading the Qs in small
timeframes. This is because out of market prints from Electronic
Communication Networks (ECNs), which have no bearing on market direction, may
inappropriately skew the QQQ chart. As the Qs correlate 1:1 with the
Nasdaq E-Mini Futures (NQ) contract – otherwise an unsustainable arbitrage
condition would exist – the NQ chart can be a better proxy for trading the Qs in
small timeframes.
In the example below, note the out of market QQQ prints which, if considered,
would have provided the trader with false signals compared to the true market
movement. The QQQ chart is also cluttered with additional and irrelevant
market "noise."
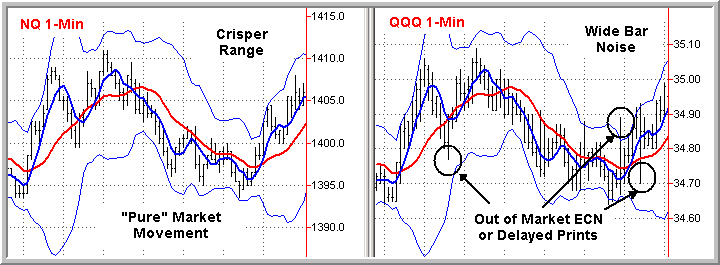
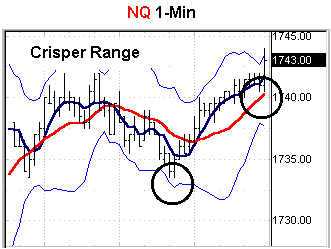
Conversely, when viewing
long term weekly and monthly charts, you’ll need to review either a QQQ, NDX,
or COMPX chart since the Nasdaq futures contracts roll over quarterly and
you’ll be lacking sufficient data for earlier periods.
We’ll alternate between QQQ and NQ charts throughout the rest of the
material to help you become comfortable with either, noting the equivalent QQQ
price when using NQ charts. Again,
the two are virtually interchangeable and the NQ charts can help eliminate
unnecessary noise on the smaller intervals.
We’ll often use QQQ charts in the trading “simulation†to better
provide you with an approximation of profit and point potential.
Yet I recommend using the NQ chart if you are trading timeframes less
than a 13-minute period.
Translations on NQ point vs. QQQ price increments are fairly straightforward as
20 points on the NQ contract is approximately equal to $0.40 on the Qs.
And in case you’re wondering why I choose not to follow the full-sized
Nasdaq Futures contract (typically labeled ND), I prefer the liquidity of the
E-Mini over the full contract to better gauge liquid market sentiment.
What studies and indicators
do I use to guide my QQQ trading?
I basically want to know
three things to guide my trading decisions: trend, strength, and trading range.
While there are many indicators that provide this information, I’ve
settled on a trio of indicators: Moving Averages to detect trend, Stochastics
to determine momentum strength, and Bollinger Bands to determine range.
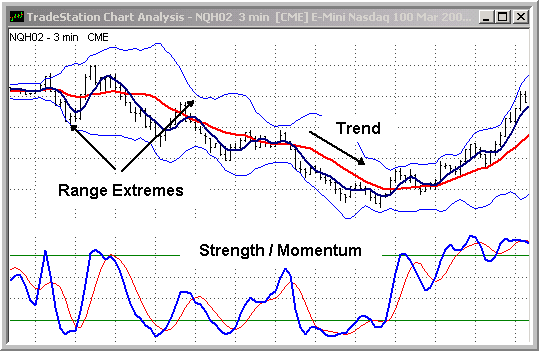
Moving Averages (Trend)
I use Moving Averages (MAs)
to calculate the average value of the market over time. I
use five- and 15-period simple on all of my charts with the following settings:
Simple, Period Close, and Zero Offset. Of
course other combinations work well and there’s no hard and fast rule, so I
encourage you to find a combination with which you’re comfortable.
I find the 15-period MA particularly useful in helping to define trend
support or resistance, and a price cross (or five-period cross for those seeking
greater confirmation) over the 15-period can help provide clues as to potential
trend reversals. The slope of the
15MA is helpful in terms of defining the strength of a trend, with a steeply
sloped line reflecting a trend of significant strength.
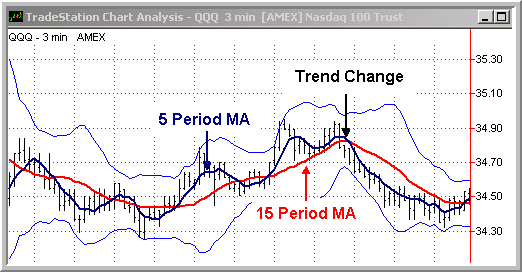
You
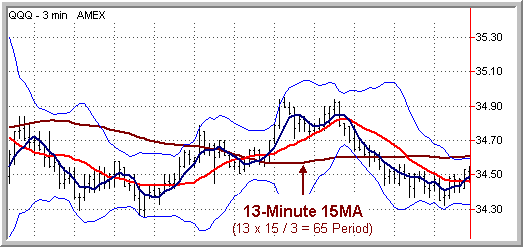
can also display the 15-period MA of a larger timeframe by calculating and
applying the equivalent number of periods on the lesser timeframe. In the chart
below, we’ve superimposed an approximation of the 13-minute 15-period MA by
multiplying 13 minutes x 15 periods and then dividing the result by 3, to arrive
at a 65-period MA. Shortly, we’ll review how charts and MAs of multiple time
periods can help guage profit potential and guide entries and exits.
Bollinger
Bands (Range)
I
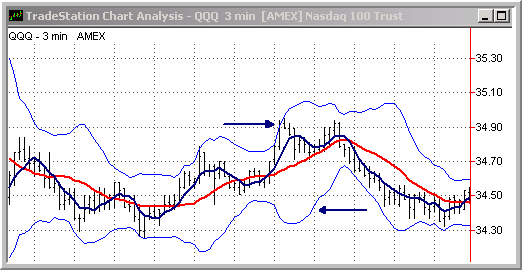
use Bollinger Bands to help define the current trading range and volatility.
Bollinger Bands were created by John Bollinger and reflect plotted standard
deviation levels above and below moving averages. The bands, which are
represented below by the two thin blue lines, measure volatility, are
self-adjusting, and are similar in concept to envelopes.
Settings
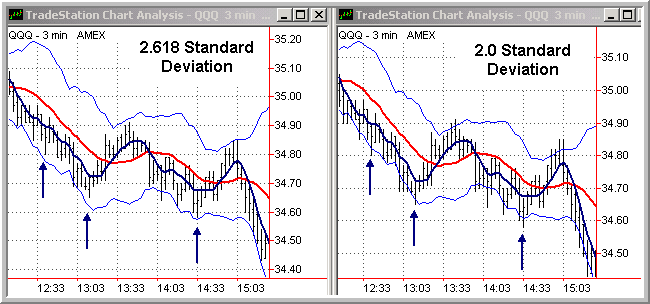
that I prefer include 13-period, period close, and a purposely wide Standard
Deviation of 2.618. While many traders use a standard deviation closer to 2.0,
which will have the impact of narrowing the bands, I prefer a visual guide
depicting range extremes. Note the visual differences between using a higher and
lower standard deviation. As with any measure, personal preference and intent
should dictate absolute settings. Bollinger bands work well with MA resistance
or support on larger timeframes.
Bollinger Band rules of thumb include:
(1) a move that originates at one band tends to move to the other, and (2) sharp
price changes tend to occur after bands tighten.
Stochastics
The
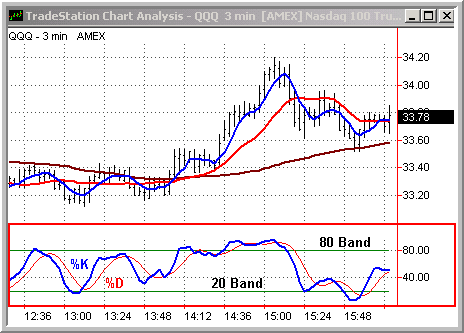
Stochastics tool is an oscillation indicator that measures momentum excesses in
the market. Stochastics are displayed in two lines typically referred to as %K
and %D, are measured in units between zero and 100, with sub-20 band readings
often reflecting an oversold market and 80-plus band readings often depicting an
overbought market. While a general rule, keep in mind that oversold and
overbought markets can become even more extreme, and that readings between 20
and 80 can sometimes reflect overbought or oversold on a relative basis under
certain conditions. My settings include %K length of 15-Period, %K Smoothing of
3, and %D Smoothing of 5, yet stochastic settings vary from platform to platform
and your chart vendor may require setting additional parameters.
As with any single indicator, stochastics are only relevant when used in
combination with other indicators.
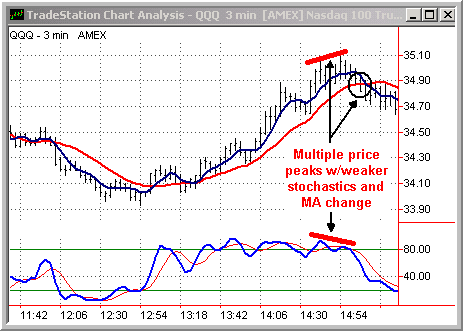
One
particularly useful attribute of Stochastics, which will be reflected in some of
our Q setups, is when the Stochastics indicator “diverges†from price near
market tops and bottoms. Such divergence can provide the astute trader with a
"heads-up" as to a potential reversal, which when confirmed by a trend
reversal, can lead to profitable opportunities.
Piecing
It All Together
I
view MAs, Stochastics and Bollinger Bands as three indicators as the three
necessary legs of a trading stool. The
stool can’t stand on just one, and remove one and the other two quickly become
meaningless. Stochastics that appear
oversold can become more oversold and continue to trend further. Positive
stochastics vs. price divergence often means little until trend indicators
reverse. Yet by combining trend,
strength and range indicators on multiple timeframes, trade patterns and
opportunities can begin to appear out of the chaotic market.
It’s
also extremely important to me to understand the perspectives and impacts that
different time periods have on my Q trades. For
example, you’ll often hear me say “When you’re chopping trees for a
living, you need to make sure the forest isn’t burning down!â€
To gain appropriate perspective, I prefer to monitor three timeframes: my
traded timeframe, a shorter interval that can help fine-tune trade
entries and management, and a larger timeframe for a longer-term
perspective. While there’s no
hard-and-fast rule, combinations that you may want to experiment with include:
| Larger Timeframe |
Traded Timeframe |
Fine-Tuning |
| 13-minute | 3-minute | 1-minute |
| 60-minute | 13-minute | 3-minute |
| Daily | 60-minute | 13-minute |
Trading
Variations
Before we
begin to explore preferred Q setups, keep in mind there are multiple ways to
trade profitably depending on the preference and style of the trader. Let’s look
at varied trading styles along with their associated benefits, risks, and
trade-management options. I’ll highlight my favorite Q entries in bold, which
we’ll review in detail shortly.
Trading
with and established trend
Benefits:
-
Clearly
defined support -
Underlying
momentum can compensate for less-than-optimal entries
Issues:
-
Can
get caught in emotional "chase" -
Entries
get riskier the further the trend extends -
Markets
often "chop" more than trend
Potential
Entries:
-
MA
cross in direction of the larger trend* -
Oversold
stochastics on 15MA support* -
Pullback
fade toward 15MA support
Potential
Exits:
-
Approaches
to range extremes (Bollinger Bands, 15MA of Larger Timeframe)
Premise
Stop:
-
Break
of 15MA Support
*QQQ
favorites
Trading
extremes against the trend
Benefits:
-
Profit
from emotional overreaction -
Prices
often revert to "normalcy"
Issues:
-
Against
larger protective trend -
Best
suited for scalpers -
Precise
order entry skill critical -
Trade
"supports" less critical
Potential
Entries:
-
Bollinger
Band range extremes
Potential
Exits:
-
Support
for underlying trend -
Opposite
Bollinger Band of range if oscillating
Premise
Stop:
-
Market
Hesitation -
Bollinger
Band Expansion
Trading
Trend Reversals
Benefits:
-
Early
entries in new trend -
Strong
entery and stop premise indicators
Issues:
-
Still
against existing trend -
May be
premature on extreme trends
Potential
Entries:
-
MA
trend reversal cross -
Stochastic
divergence w/MA cross
Potential
Exits:
-
Approaches
to range extremes (Bollinger Bands, 15MA of Larger Timeframe)
Premise
Stop:
-
Divergence
Deterioration -
Break
of 15MA Support
*QQQ
favorites
Trading
range oscillations
Benefits
-
Can
benefit during choppy markets, effectively compounding gains
Issues:
-
Best
suited to scalpers -
Can
get caught on wrong side of breakouts
Potential
Entries:
-
Bollinger
Bands
Potential
Exits:
-
Opposite
Bollinger Band
Premise
Stop
-
Expansion
of Bands -
Trend
Breakout
Preferred
QQQ Trade Setups
OK, now
that we’ve reviewed the important cornerstone concepts and underlying
framework, let’s focus on some of my favorite QQQ setups and strategies.
I consider them to be among my favorites because they combine probability
bias with clear entry triggers and stop premises.
MA
Cross in Direction of Larger Trend
This trend
continuation setup involves using two time periods, or what I’ll call the
“traded†timeframe and the “trigger†timeframe.
The traded timeframe consists of a trending market one desires to enter
in a low-risk, high-probability manner on a pullback toward trend support.
The trigger period is a smaller interval that for the moment is trading
in a direction opposite that of the traded timeframe.
In essence, the current trigger trend reflects the pullback attribute of
the larger period.
The
trigger period is aptly named because it provides the signal for one to enter
the trade upon a MA cross that aligns the trigger trend with the traded trend.
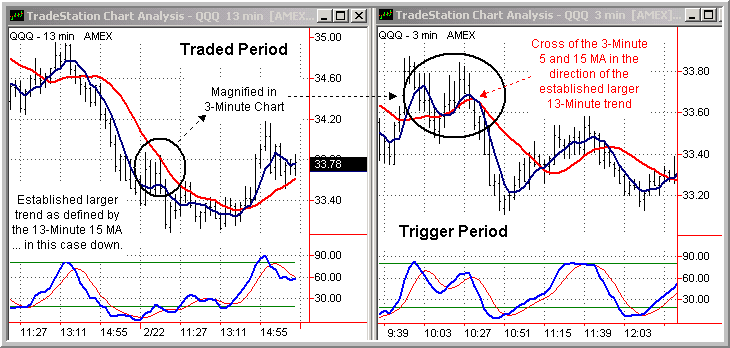
We’ll use NQ charts to illustrate the use of this technique when
trading the Qs. In this case,
we’re looking to enter on a pullback of an established 13-minute downtrend
(Chart A), using a reversal in the opposing three-minute trend to trigger the
entry.
The beauty of this
entry is twofold. First, the cross
of the trigger timeframe provides additional evidence that a continuation of the
traded trend has begun to occur, as opposed to simply fading into an entry
without such confirmation. Second,
once the trigger timeframe aligns itself with the traded period, its own 15MA
support can be used to fine-tune exits and trailing stops on the trade.
Now one of the
questions I’m asked frequently is how does one define a MA “crossâ€.
This is not easily answered as there are multiple definitions of a cross
including (in the order of occurrence) an emerging price bar cross, a completed
price bar cross, and a 5MA cross. Yet
choosing among these options reflects one of the great “arts†of trading and
one can fine-tune the entry based on personal preferences with respect to the
extent of confirmation desired prior to entry.
I’ll often enter on emerging price bar crosses, accepting the risk of a
potential wiggle.
It’s also worth
pointing out that crosses down as shown here are most easily executed when
trading the Qs, futures, and other trading vehicles that are not encumbered by
the uptick rule. Shorting a stock
on a cross down in this manner is just about impossible.
Oversold
Stochastics on Price Support
This second trend
continuation setup involves combining moving averages with the stochastic
indicator, using an oversold stochastic reading and a market that is holding its
15MA support. As with the first
setup, the intent is to seek a low-risk, high-probability trend continuation
entry, this time in terms of a shorter-term scalp for the nimble.
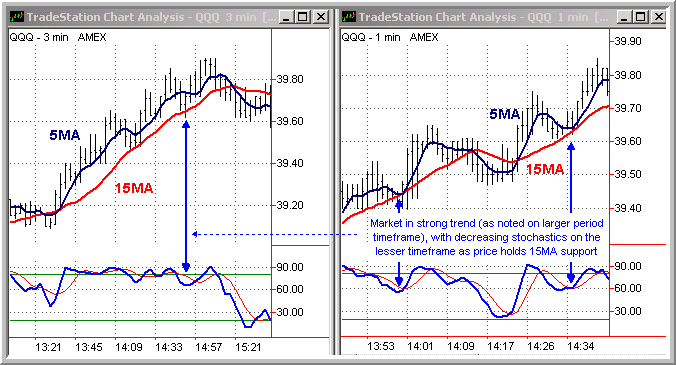
In the following
example, again using NQ charts, we have a very strong three-minute uptrend and a
one-minute subtrend that is also uptrending, yet testing support on retracements.
In two instances (13:57 and 14:34) the one-minute trend tests its 15MA
support, resting for multiple bars while the stochastic reading drops below its
key 80 band level and approaches the 50 band.
Now while 50-80 band stochastic readings by themselves don’t typically
reflect oversold conditions or result in entry triggers, they can when combined
with a market that is holding price support and can result in some nice scalp
opportunities for the short-term trader. In
this case the lower band provides the trigger to enter the trade in the
direction of the trend, with a stop activated upon a break of 15MA support.
The expectation in
this trade is that the oversold condition (oversold relative to previous
80+ band readings as opposed to an absolute basis) will be normalized by a
continuation of the current trend off its support.
MA
Cross Following Stochastic Divergence
Another favorite
entry is a significant trend reversal following significant stochastic vs. price
divergence and triggered by a trend change.
Now please note the term “trend changeâ€, meaning this particular
reversal setup reflects a market which is attempting to reverse from
“something†… specifically, a relatively meaningful trend.
In fact, the stronger the move and collective emotion, the better.
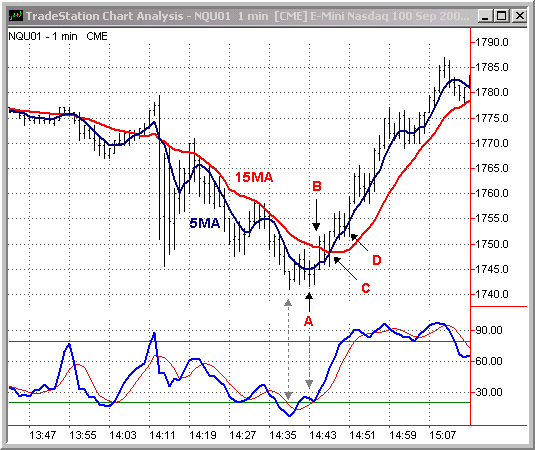
To illustrate, we’ll review a one-minute NQ chart and significant
activity following a FOMC interest rate announcement.
While the move certainly doesn’t need to be of the magnitude
illustrated here, it should be sufficiently strong to allow for profit potential
as the first trend becomes overextended, and reverts to some norm or retracement
in the other direction. We’re not
talking about markets simply trading within a narrow trading range, although one
can apply the concepts to “mini-trend†subsets of larger timeframes, for
example a reversal in a one-minute trend that merely comprises one-half of a
13-minute oscillation.
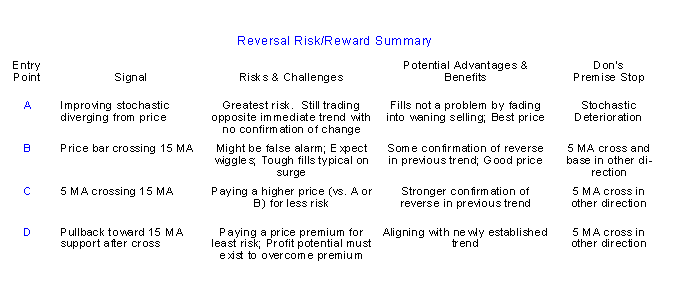
So let’s compare the benefits and risks of various entry scenarios on that
eventful day in June 2001.
A.
Enter Upon Stochastic & Price Divergence
(Highest Risk)
This is one of my
favorite signals when confirmed with follow through, as we have a testing of
another low on a strong downtrend, yet for the first time, we’re seeing a
strengthening low-band stochastic reading on the second leg of a mini
double-bottom at 14:38 and 14:42, indicating that the strength of the remaining
selling is waning. And if
selling has stopped, probability begins to shift to a likely turn.
I of course stress “if†in this scenario, as the primary risk is that
trend has not fully exhausted itself despite the strengthening stochastic, and a
dull knife can still be a knife. Basically,
this setup is analogous to a golf ball being teed up as we wait to see if there
are players interested in striking the ball.
Stops are critical upon any stochastic weakening.
So why would I
consider entering here without any confirmation of follow-through?
Well, there are two very valid reasons.
First, there is far lesser competition for fills as one is essentially
“fading†into the market (guess who the last few sellers are selling to?),
and we all know that fills can often be a great challenge upon confirmation as
is the case with entry B below.
One also obtains a very good entry price, and carving out
wholesale/retail price differential is paramount when trading intraday. Yet
I would clearly consider this sort of an entry only if I had extremely
tight stop and reentry discipline, and if I felt the earlier move set up enough
potential for a snapback profit that would exceed the accompanying risk.
B.
Enter Upon Price Bar Penetrating 15 MA (Less
Risk)
Here, at least we
have at least some confirmed market interest in the setup, as shown by a follow
through in the price bar above the 15 MA, which is less risky than A
while still presenting a few challenges including a possible false alarm (see
14:20 and 14:33), and very tough fills as the whole world jumps in as seen in
the height of the 14:44 price bar. Wiggles
would be expected given the immediate surge, and stops necessary with any cross
and base to the downside.
C.
Enter Upon 5 MA Crossing 15 MA (Lesser
Risk)
This is perhaps the
entry that best balances risk and reward as we have further confirmed interest
vs. A and B,
and attempted price basing on the upside of the 15 MA as evidenced by the 5 MA
cross. The MA cross entry often
avoids the false alarms that can be generated by B,
which is why a MA cross following improving stochastics at the end of a strong
trend is one of my personal favorite reversal entries.
As always, stops remain critical and a MA cross back in the other
direction would trigger my protective exit.
D.
Enter Upon Pullback on New Trend (Least
Risk)
This entry basically
attempts to align oneself with the new trend and is less of a reversal entry
than an early trend entry. The 15
MA which had been prior resistance now becomes support for the new move until
broken which would again trigger a stop. The
earlier the pullback the better, as the farther the trend continues we’ll
start the dance all over again by beginning to look for scenario A
on the other side.
As trading requires
continual risk/reward assessment, there are clear risk vs. price trade-offs
associated with each entry. Better
prices and fills reflect additional risk, while one pays varying price premiums
to compensate for reduced levels of risk. Using
the example above, there was roughly a $0.25 price differential on the Qs
between entries A and D.
So to summarize:
Part 3 Quiz
Q: T/F
There is virtually no difference between movement in the Nasdaq 100 futures and
the QQQ.
A: True.
The Qs must remain in a 1:1 relationship with the futures without an
unsustainable arbitrage condition occurring.
Q: T/F Don
prefers to use NQ charts to trade the Qs on smaller timeframes.
A: True.
Out-of-market ECN or delayed prints can distort the QQQ chart and provide
false triggers on smaller timeframes.
Q: T/F
Which of the following is not one of Don’s three primary trading
indicators?
A.
Stochastics
B.
Bollinger Bands
C.
Volatility Indices
D.
Moving Averages
A: C.
While volatility indices can help detect market complacency and fear, Don
uses Bollinger Bands to detect range and volatility when selecting and managing
specific trades.
Q:
Stochastics help determine:
A.
Trend
B.
Range
C.
Momentum Strength
D.
Volume
A: C. Stochastics
help determine the current strength of market momentum.
Q: Which of the
following correctly defines attributes of Bollinger Bands?
A.
Bands tighten during periods of high volatility.
B.
A touch of an upper band is a precursor to an immediate reversal.
C.
Sharp price changes tend to occur after bands tighten.
D.
All of the above.
A: C. A is not
correct because bands widen during periods of high volatility and B is incorrect
because band touches do not guarantee that a reversal is imminent.
Q: Which
standard deviation does Don recommend in establishing Bollinger Band settings?
A.
1.618
B.
2.000
C.
2.618
D.
3.000
A: Don prefers a
standard deviation of 2.618.
Q: Which of the
following can help define trend support?
A.
5-Period Moving Average
B.
15-Period Moving Average
C.
Upper Bollinger Band
D.
Stochastic Divergence
A: B.
The 15-Period Moving Average can provide a good visual indicator for
trend support.
Q: T/F The
slope of moving averages can help identify trend strength.
A: True.
A steep slope is indicative of a strong trend.
Q: How many
timeframes does Don recommend using for trade management?
A.
One
B.
Two
C.
Three
D.
Four
A: C. Don recommends
monitoring the traded timeframe, a smaller interval, and a larger interval for
effective trade management.
Q: T/F
Don’s QQQ strategies are only applicable to intraday trading.
A: False.
Like many methods, the Q concepts are fractal in nature and apply equally
to longer swing timeframes.
Q: Which of
the following is not one of Don’s favorite QQQ trade setups?
A.
15-Period MA cross following stochastic divergence
B.
Upper Bollinger Band reversal
C.
Oversold stochastics on support
D.
MA cross in direction of larger trend
A: B.
Trading range extremes has less trade “safety†and is thus not one of
Don’s favorites.
Q: Which of
the following reflects the least risky entry on a potential QQQ trend
reversal?
A.
Going long on a lower Bollinger Band
B.
Entering upon seeing stochastic divergence
C.
Entering on a price or 15MA cross following stochastic divergence
D.
None of the Above
A: C. A trend
reversal confirmation as defined by a crossover of the 15MA can help reduce the
risk of catching falling knives or shorting rising rockets.
Q: Which of
the following are potential QQQ trend continuation setups?
A.
Three-Minute MA cross down when the 13-minute is downtrending
B.
13-Minute MA cross confirming positive low-band stochastic divergence
C.
Three-Minute stochastics dropping to 60 band as price holds 15MA support
D.
A & B
E.
A & C
F.
None of the Above
A: E.
Both A & C are trend continuation trades, while B sets up the
potential for a trend reversal.
Q: A risk in defining a trend change as a price (vs. a 5MA) crossing a 15MA
when positioning for trend reversals is:
A.
The move may merely reflect a price wiggle
B.
Attempting to be “early†can result in additional risk that the
previous trend has not yet exhausted itself
C.
Such a strategy can result in greater personal trade volume to due more
frequent stops and reentries
D.
A & C
E.
All of the above
A: E.
While a potential trigger, traders must still acknowledge that entering
upon initial price movement beyond 15MA support or resistance may not reflect a
full reversal, and that protective stops must be honored should the market break
back to the other side. Alternatively,
one can choose to rely on period closes or a 5MA for further confirmation.
Q: T/F A
QQQ stochastic reading below the 20 band is a buy signal.
A: False.
While potentially oversold, markets simply showing sub-20 band
stochastics can become more oversold. As
such, waiting for reversal confirmation via trend changes is key.
