Visiting The Turk
It was
choppy but up yesterday, as
the Dow
(
$INDU |
Quote |
Chart |
News |
PowerRating) finished +0.5%, the SPX
(
$SPX.X |
Quote |
Chart |
News |
PowerRating) +0.2% and the NDX
100
(
$NDX.X |
Quote |
Chart |
News |
PowerRating) +1.0%. NYSE volume was 1.5 billion, a volume ratio of 60,
which puts the three-day moving average now at a short-term overbought 72,
breadth was +512. Techs again led and pushed higher, while the SOX closed +3.2%.
From Thursday through
11:45 a.m. ET yesterday, the Dow traded in a 77 point range between 8880 and
8803. After a quick break down to 8756 on the 12:30 p.m. bar, the Dow trended
straight up into the close at 8851, right back to the middle of the four-day
trading range. The SPX closed at 932.87. The major indices still remain in
positive chart patterns for this rally and also pushing the higher band of
resistance. I don’t expect any downside pressure until after the holiday.
Right now I see rising
price and declining volume in the SMHs at their upper boundary. The last three
days’ highs have gone 28.75, 28.96 and 29.58 yesterday, as volume has gone 14.3
million, 8.2 million, and then a decline to 6.1 million yesterday. All three
days had higher lows.
It will be a bit
disappointing when this bear market becomes history because it has provided some
great moves both long and short. Bear markets are much easier to trade in both
directions because the rallies are so sharp from the oversold fear levels as the
shorts ring the register and cover, along with the perpetual state of the mutual
funds that live on the long side and can’t have that much cash on the sideline.
The retracement to the
longer-term moving averages have provided some excellent selling opportunities,
while the oversold levels have occurred at key inflection points like the 2.0
and 3.0 standard deviation or volatility bands, in addition to Fib retracements
to previous bear market lows and also Fib extensions of the previous leg up. If
you have the skills to trade both ways, there is a much larger pie available to
you.
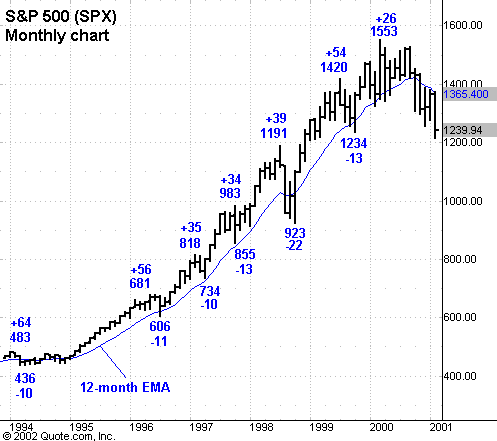
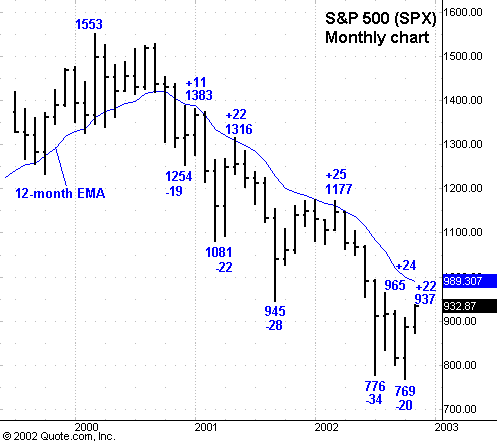
I have enclosed the
monthly charts of the parabolic bull market and also the current bear market so
you can see the extent of the percentage moves in both the bull and bear
markets. I started the bull market from the flat base breakout in early 1995 as
the Republicans took the Congress for the first time in 40 years. As you can see
in the bull chart, there wasn’t much room on the downside moves, the biggest
being the -22% 1998 mini-bear market decline. The 12-month EMA is my favorite
long-term moving average and should be incorporated in your longer-term trading
around your other strategies for being long the market in your IRAs and 401(k)s.
The bear chart points out
the outstanding opportunities you have had to participate in some volatile
two-way action. As you can see, the SPX is right in the percentage zone of its
previous retracement to the 12-month EMA which is now just 989. That is the
primary reason I am hedging longs into this retracement and have taken off about
40% of the initial position taken on the reversal of the 776 low.
This commentary is being
done on Tuesday night because I have to go down to the NYSE floor to see the
Turk. If I see him, I’ll say hello to him for you.
Have a good trading day.


Â
