VIX Trading Strategies and the 5% Solution
Back at the beginning of the month, as the markets were plunging lower, I suggested that traders could use the VIX or CBOE Volatility Index to help them analyze whether or not it made sense to jump on the bearish momentum bandwagon (Short Term Trading Strategies and the VIX: Bottom or Bounce?)
Drawing on the unique analysis of the VIX that Larry Connors has conducted for more than a decade – most recently published in his book, Short Term Trading Strategies That Work – I concluded that while stocks looked capable of only going lower in early March, the ideal time for betting against stocks had already passed. Instead, it seemed to me, short term traders need to be thinking more about covering their short positions – or even putting out a speculative long or two.
The basis of this analysis lies in Larry’s observation that when the VIX is stretched above its 10-day moving average by 5% or more, markets tend to rally. This tendency is far more pronounced when markets, such as the S&P 500, are trading above their 200-day moving averages – in fact, there are actual trading strategies based on the VIX being stretched above its 10-day moving average when the S&P 500 is above the 200-day.
However, we can still take from these strategies a fundamental point about the VIX: the further it stretches above its own short term mean (i.e., the 10-day moving average) the greater the amount of fear in the market. And as mean reversion traders, we know that when fear reaches extremes, the likelihood of a reversal – and a rally in the markets – only increases. Thus, from a probability standpoint, we do not want to be “too short” when we see the VIX separate dramatically to the upside from its 10-day moving average.
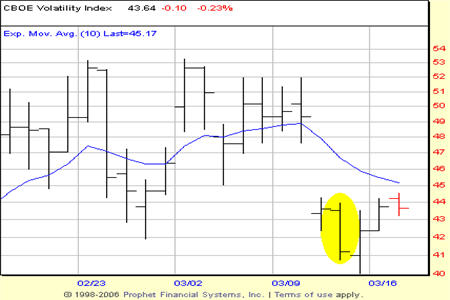
On the other hand, what is the proper trading response when the VIX is stretched significantly below its 10-day moving average? Consider this from Short Term Trading Strategies That Work: “the lower (the VIX) is below the 10-day moving average, the more the market is overbought and likely to move sideways-to-down in the near future.”

Last Thursday, on March 12th, the VIX closed just over 41 while its 10-day moving average was at about 46 1/2. This represented a stretch of more than 13% – very much within our 5% stretch parameters. Since then, we’ve seen the VIX edge higher (closing on the 16th at 43.74) and stocks – as Larry suggested they would – moving sideways.
Will stocks resume their advance once this sideways trading has run its course? The best bet for short term traders is to continue to watch the VIX as the stretch that signaled sideways trading in stocks over the past few days has moderated. If the VIX dives lower again, then we are likely headed higher and deeper into overbought conditions. If instead the VIX continues to move higher, then we should be prepared for a potential reversal of the current advance, lower stock prices, and a return to the sort of anxiety and panic that characterized trading at the end of February and beginning of March.
In either situation, however, there is opportunity for short term traders who know and understand how the VIX works.
David Penn is Editor in Chief at TradingMarkets.com.
