Volatility And Opportunity
Another
big day across the board for
indices, HOLDRs and stocks alike. NYSE volume hit 1.8 billion vs. two billion on
Thursday, but the volume ratio was 90 following up the 81 on Thursday. Both
Thursday and Friday had advancing volume of 1.6 billion. Breadth picked up at
+1837 vs. +748 on Thursday.
The SPX
(
$SPX.X |
Quote |
Chart |
News |
PowerRating)
closed at 835.32, +3.9%, the Nasdaq
(
$COMPQ |
Quote |
Chart |
News |
PowerRating) 1210.48, +4.1%, and the Dow
(
$INDU |
Quote |
Chart |
News |
PowerRating) 7850.29, +4.2%. All three major indices closed above their 20-day
EMAs. Both the SPX and Dow are up 9.8% low to high on the two wide-range-bar
days, with Friday’s buying pressure almost above all of Thursday’s range. That’s
exactly what one wants to see the day after a wide-range-bar reversal day. Both
the Nasdaq and
(
SMH |
Quote |
Chart |
News |
PowerRating)s had their entire Friday’s range above Thursday’s
wide-range bar.
The SMHs, which closed at
20.36, +8.4% on the day, also closed above the 20-day EMA of 20.05 on excellent
volume. The BKX, XBD and CYC are all up about 10% for the two days, and that’s
what we want to see. The retail index, which is the RLX, is +6.5% for the two
days, while the SOX is the leader at +14.6% on an absolute basis, and the SMHs
are +20% low to high in four trading days.Â
Because of the strong
two-day percentage moves by the major indices, you are certainly alert for a
third day pullback or pause day. If we get an opening or a trade through of
Friday’s high, then reversal below that high, that would be an intraday short
opportunity with tight stops. Also use the 20-day EMA as a pivot point both
ways. Any pullbacks to the intersection of Thursday’s high and Friday’s low for
the indices/HOLDRs and certain stocks might give you some good long entry
patterns.
We start out on this
holiday with the futures trading lower, new terrorist news, and a week of
big-cap earnings coming out. To me that means volatility and opportunity.Â
Have a good trading day.
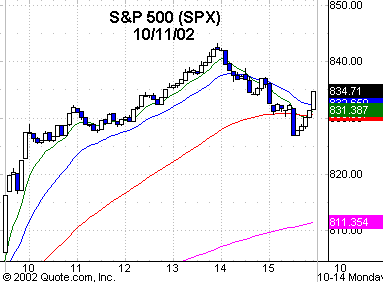
Five-minute chart of
Friday’s SPX with 8-, 20-,
60- and 260-period
EMAs
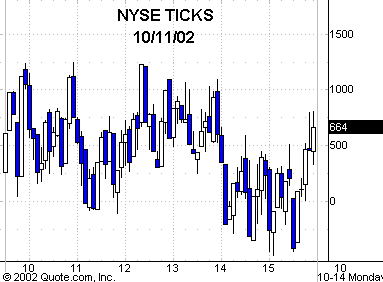
Five-minute chart of
Friday’s NYSE TICKS