Volatility Bands Continue To Provide Excellent Trades
What Monday’s Action Tells
You
NYSE total volume of 1.8 billion shares
attests
to the month-end activity. The volume ratio finished at 31 and breadth
was -721.
However, the market action had a “V” shape as programs dominated
action.
The SPX
(
$SPX.X |
Quote |
Chart |
News |
PowerRating) traded in a
contracted
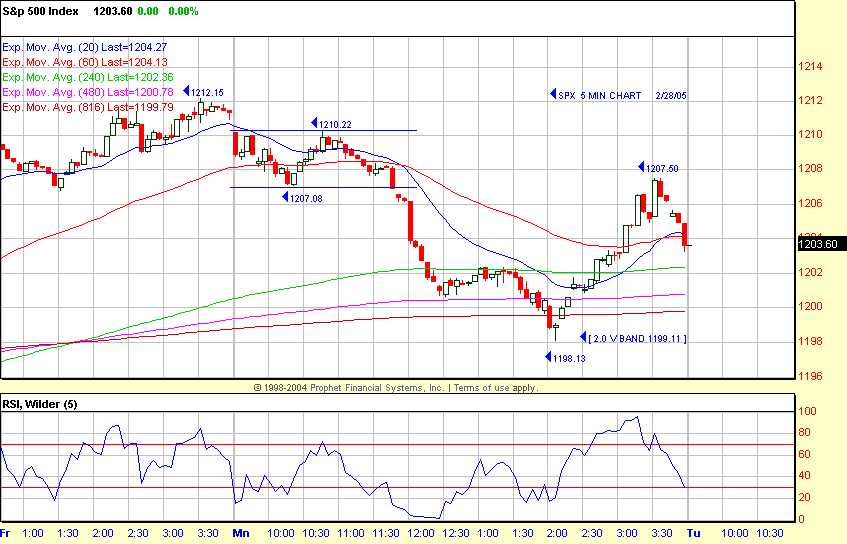
range of just 3.1 points from 9:30 a.m. – 11:45 a.m. ET. Program
lights
lit up, and there was an air pocket down to an intraday low of 1198.13 on
the
2:05 p.m. bar, which is a frequent reversal time. The SPX reversed from this
2.0
volatility band level of 1199.11 and made up the entire air pocket to
1207.50 at
3:35 p.m., but faded to a 1203.60 close, -0.6% on the day. The Dow
(
$INDU |
Quote |
Chart |
News |
PowerRating)
was -0.7% to 10,766, the Nasdaq
(
$COMPQ |
Quote |
Chart |
News |
PowerRating) -0.5% to 2052 and the
(
QQQQ |
Quote |
Chart |
News |
PowerRating) -1.1% to 37.22.
The sectors were all red, led by the
(
BBH |
Quote |
Chart |
News |
PowerRating),
-6.5%, on overt news and were followed by the semis with the
(
SMH |
Quote |
Chart |
News |
PowerRating) -1.3%
and
the
(
OIH |
Quote |
Chart |
News |
PowerRating) -1.1%. The
(
TLT |
Quote |
Chart |
News |
PowerRating) was -1.1% to 89.74 and -4.8% from the
94.74
high on 02/09.
Traders had 2.0
volatility band long trades
in
the major indices yesterday, while the SMH provided a
Trap Door reversal
short
that declined -1.5% from entry before resuming the direction of the open
which
then reversed again because of the program air pocket after 11:45
a.m.
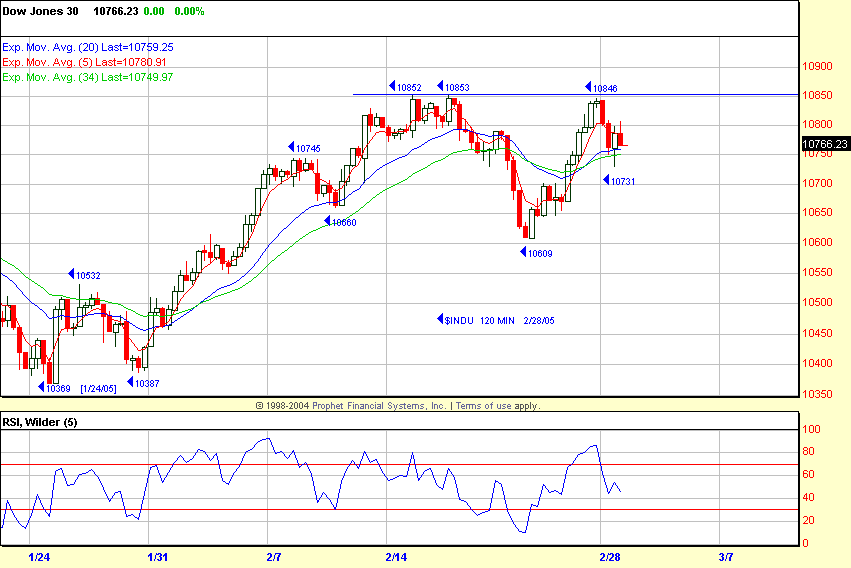
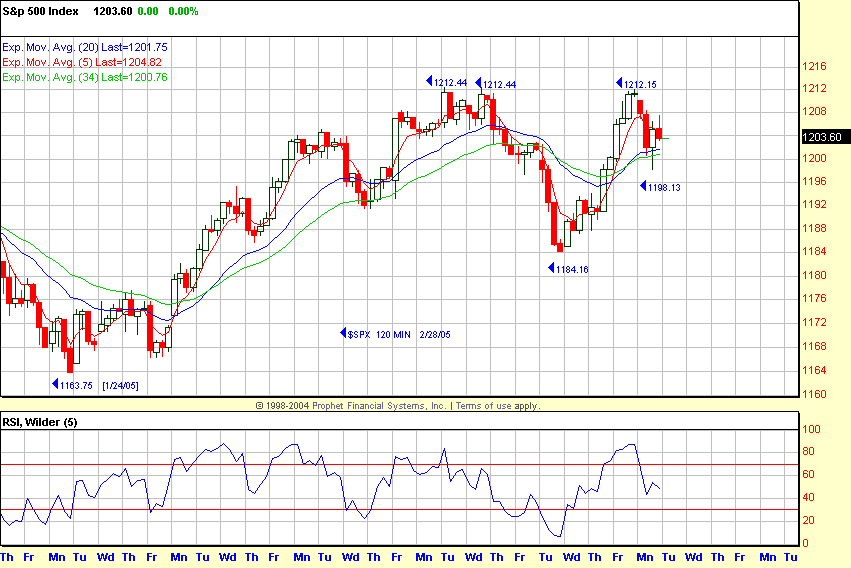
Traders start today looking at triple tops
just
above in both the SPX and Dow, so intraday short setups can be worked
against
these tops if we rally and then be ready to reverse the trade to the upside
if
the Generals push the button. The next short-term position trade depends on
whether the major indices are advancing or declining into next week’s time
zone.
The longest intraday trend which I look at is the
“523” Trend
Method using the
120-minute chart. The SPX 34 EMA is 1200.76 and the Dow 10,750. The QQQQ 523
Trend is negative with both the 5 and 20 EMAs below the 34 EMA which is
37.35
vs. the 37.22 close.
Have a good trading day,
Kevin Haggerty
P.S. I will be
referring to some charts here:
www.thechartstore.com in the future.


