Want to map out Friday? Use this 6-day pattern in the S&Ps
Stock
index futures opened Thursday’s session lower as the equities markets continued
to consolidate the gains from the beginning of the week. After a choppy first
hour, the futures saw a boost after the energy numbers reported that crude oil
and gas supply worries weren’t as bad as expected. That attempt sputtered
out at the gap fill and was followed again by a failed attempt to move higher,
before the futures churned in a tight range through the lunchtime lull. A
last hour attempt to break south also couldn’t find any followers and prompted
short-covering back up into the opening range.
The
December SP 500 futures finished Thursday’s session with a loss of -4.00 points,
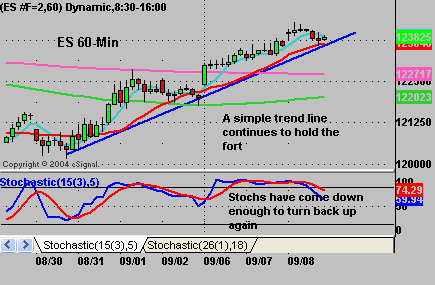
while the Dow futures slid -30 points. Looking at the daily charts, both
contracts paused from their Gartley reversals, and posted a market structure
high. On an intraday basis, simple 60-min trend lines are being tested.Â
For you daily 3-Line Break followers, the ES remains long with a Break Price of
1210.00, while the YM is long with a Break Price of 10450.

Are You Playing Offense or
Defense?
What constitutes playing
offense in the market, and what is a defensive stance? Defense means
trying not to lose, and usually taking the 2nd or 3rd opportunity. It
means trying to hold your own, and waiting for the perfect opportunity.Â
In general, it means not being in control. An offensive stance, on the
other hand, starts with being in control, clearly seeing the potential and
making trades when they first appear, not dwelling on negative outcomes,
bouncing back after making mistakes, constantly attacking the market in a
consistent way, and making trades when, and only when, the
opportunity exits. Comparing trading to sports, on the field a
strong offensive team will control the ball longer. An offensive trader is
more likely to be in tune with the market and aboard for the bigger moves.Â
Defense is basically trying to stop the market, characterized by quick entry and
exit, and generally calls for more perfection in order to get good results.
Daily Pivot Points for 9-9-05
| Symbol | Pivot | Â Â Â Â Â R1 | R2 | R3 | S1 | S2 | S3 |
| INDU | 10600.41 | 10631.47 | 10667.56 | 10698.62 | 10564.32 | 10533.26 | 10497.17 |
| SPX | 1232.36 | 1235.20 | 1238.74 | 1241.58 | 1228.82 | 1225.98 | 1222.44 |
| ES Z5 | 1238.83 | 1241.92 | 1245.83 | 1248.92 | 1234.92 | 1231.83 | 1227.92 |
| SP Z5 | 1238.90 | 1241.80 | 1245.60 | 1248.50 | 1235.10 | 1232.20 | 1228.40 |
| YM Z5 | 10636.67 | 10666.33 | 10701.67 | 10731.33 | 10601.33 | 10571.67 | 10536.33 |
| BKX | 98.74 | 99.10 | 99.65 | 100.01 | 98.19 | 97.83 | 97.28 |
| SOX | 477.18 | 482.35 | 485.90 | 491.07 | 473.63 | 468.46 | 464.91 |
Weekly Pivot Points for Week of 9-5-05
| Symbol | Pivot | Â Â Â Â Â R1 | R2 | R3 | S1 | S2 | S3 |
| INDU | 10436.83 | 10524.30 | 10601.22 | 10688.69 | 10359.91 | 10272.44 | 10195.52 |
| SPX | 1215.46 | 1229.85 | 1241.68 | 1256.07 | 1203.63 | 1189.24 | 1177.41 |
| ES U5 | 1214.17 | 1234.33 | 1248.92 | 1269.08 | 1199.58 | 1179.42 | 1164.83 |
| SP U5 | 1216.63 | 1231.57 | 1243.43 | 1258.37 | 1204.77 | 1189.83 | 1177.97 |
| YM U5 | 10439.33 | 10551.67 | 10640.33 | 10752.67 | 10350.67 | 10238.33 | 10149.67 |
| BKX | 97.99 | 99.41 | 100.43 | 101.85 | 96.97 | 95.55 | 94.53 |
| SOX | 467.91 | 473.53 | 479.64 | 485.26 | 461.80 | 456.18 | 450.07 |
Please feel free to email me with any questions
you might have, and have a great trading week!
Chris Curran
Chris Curran started his trading career at the
age of 22 with a national brokerage firm. He combines fundamentals and
technicals to get the big picture on the market. Chris has been trading for 15
years, starting full time in 1997, and has never had a losing year as a
full-time trader.
